Kiel Trade Indicator
The Kiel Trade Indicator estimates the trade flows (imports and exports) of 75 countries and regions worldwide, as well as world trade as a whole.
Update information
We are currently improving the algorithm of the Kiel Trade Indicator. During this time, updates will be done irregularly at the beginning of a month and without numbers for imports and exports. The improved algorithm will be ready by early summer.
Ship Data
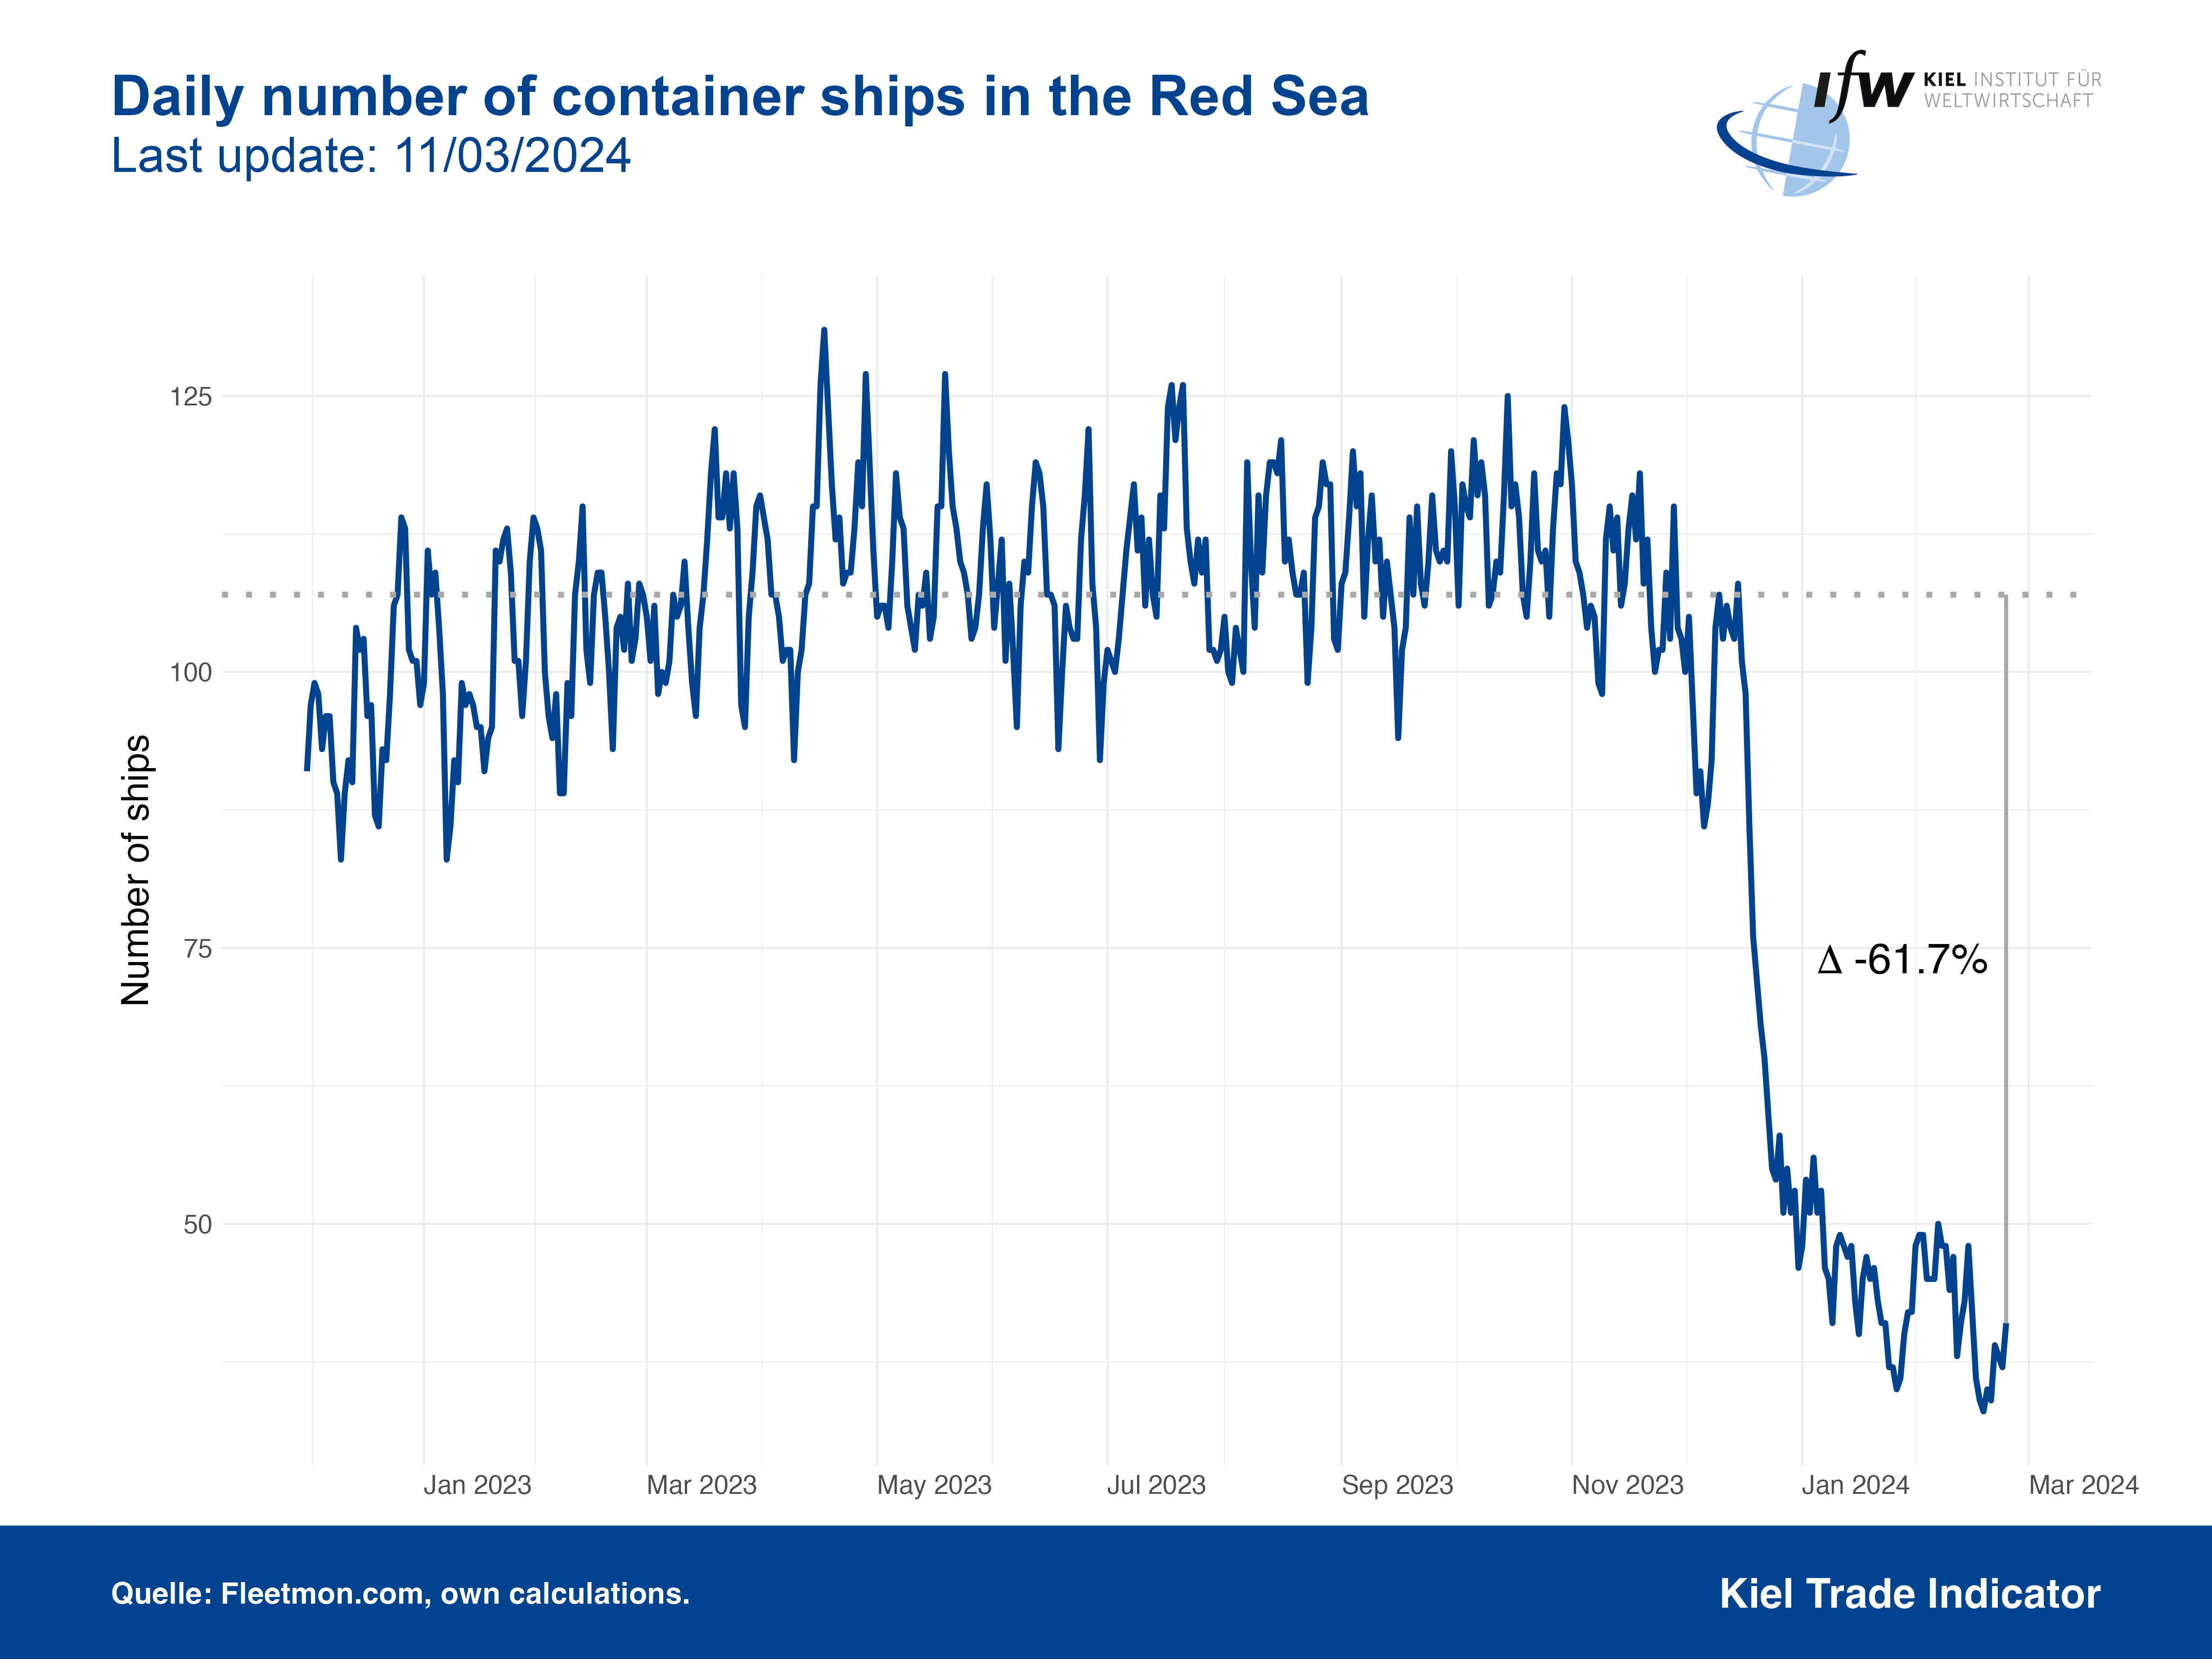
This graph shows the daily number of container ships in the Red Sea.
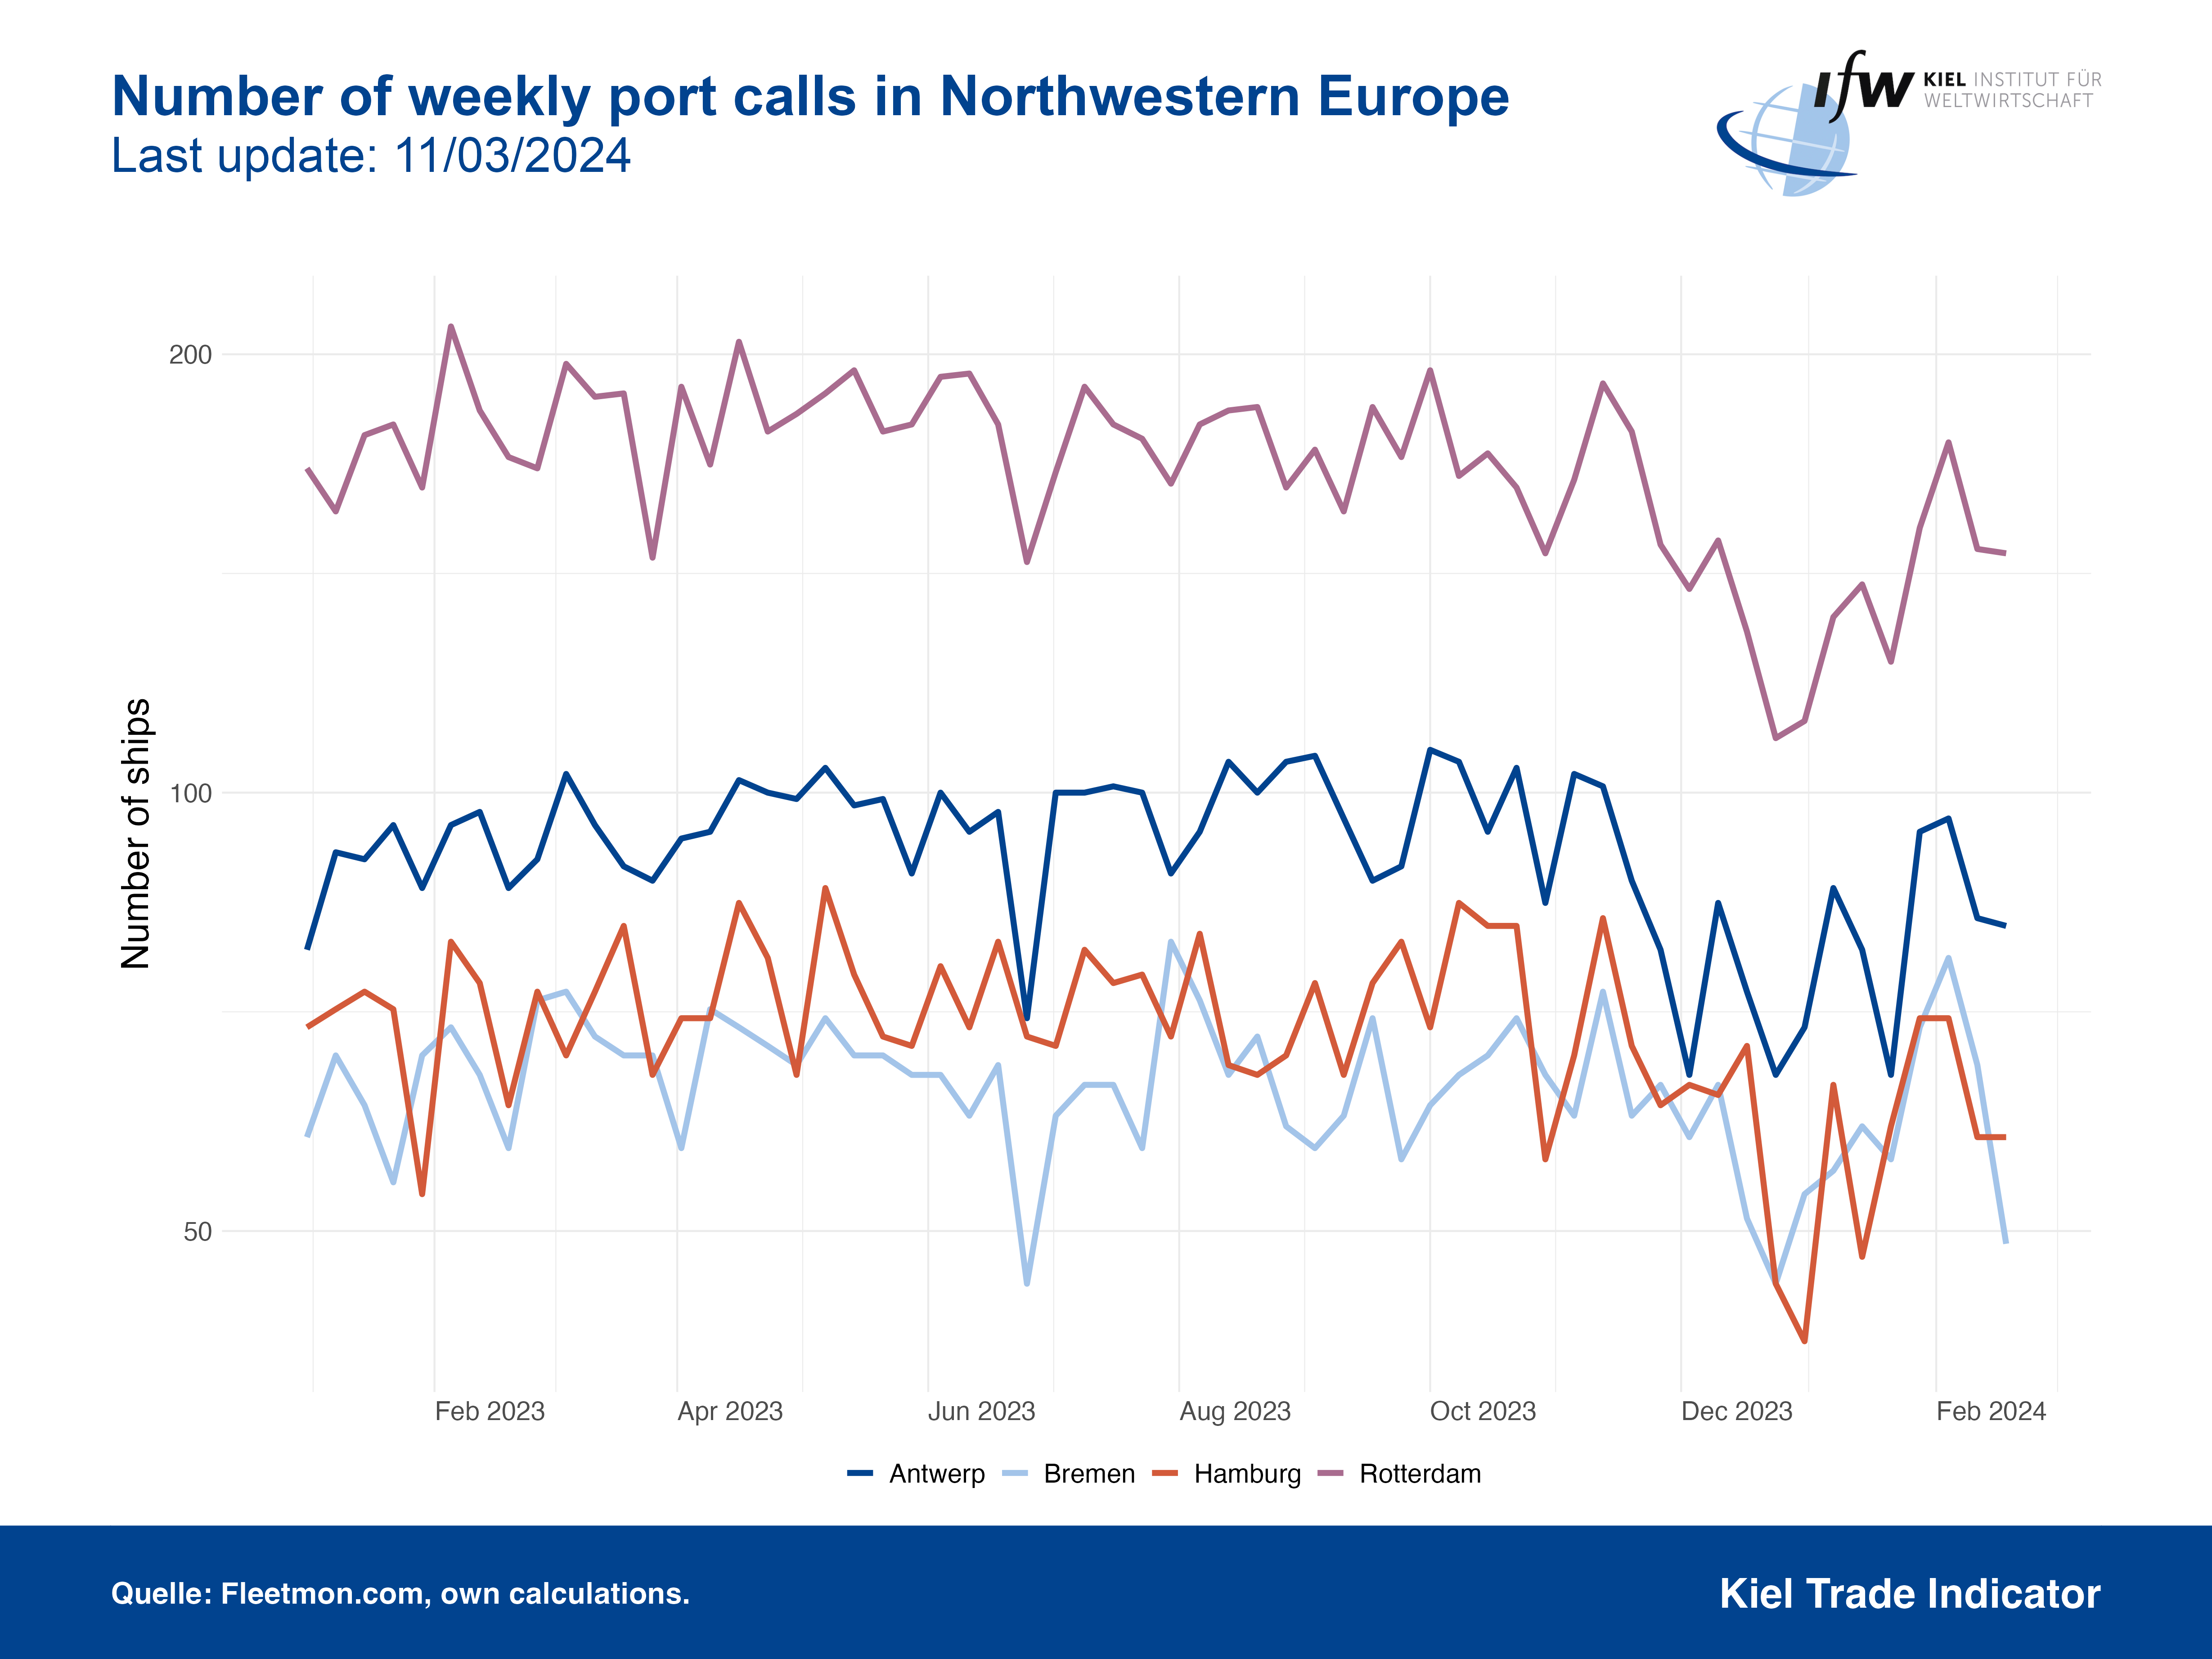
This chart shows the weekly port calls in Northwest Europe.
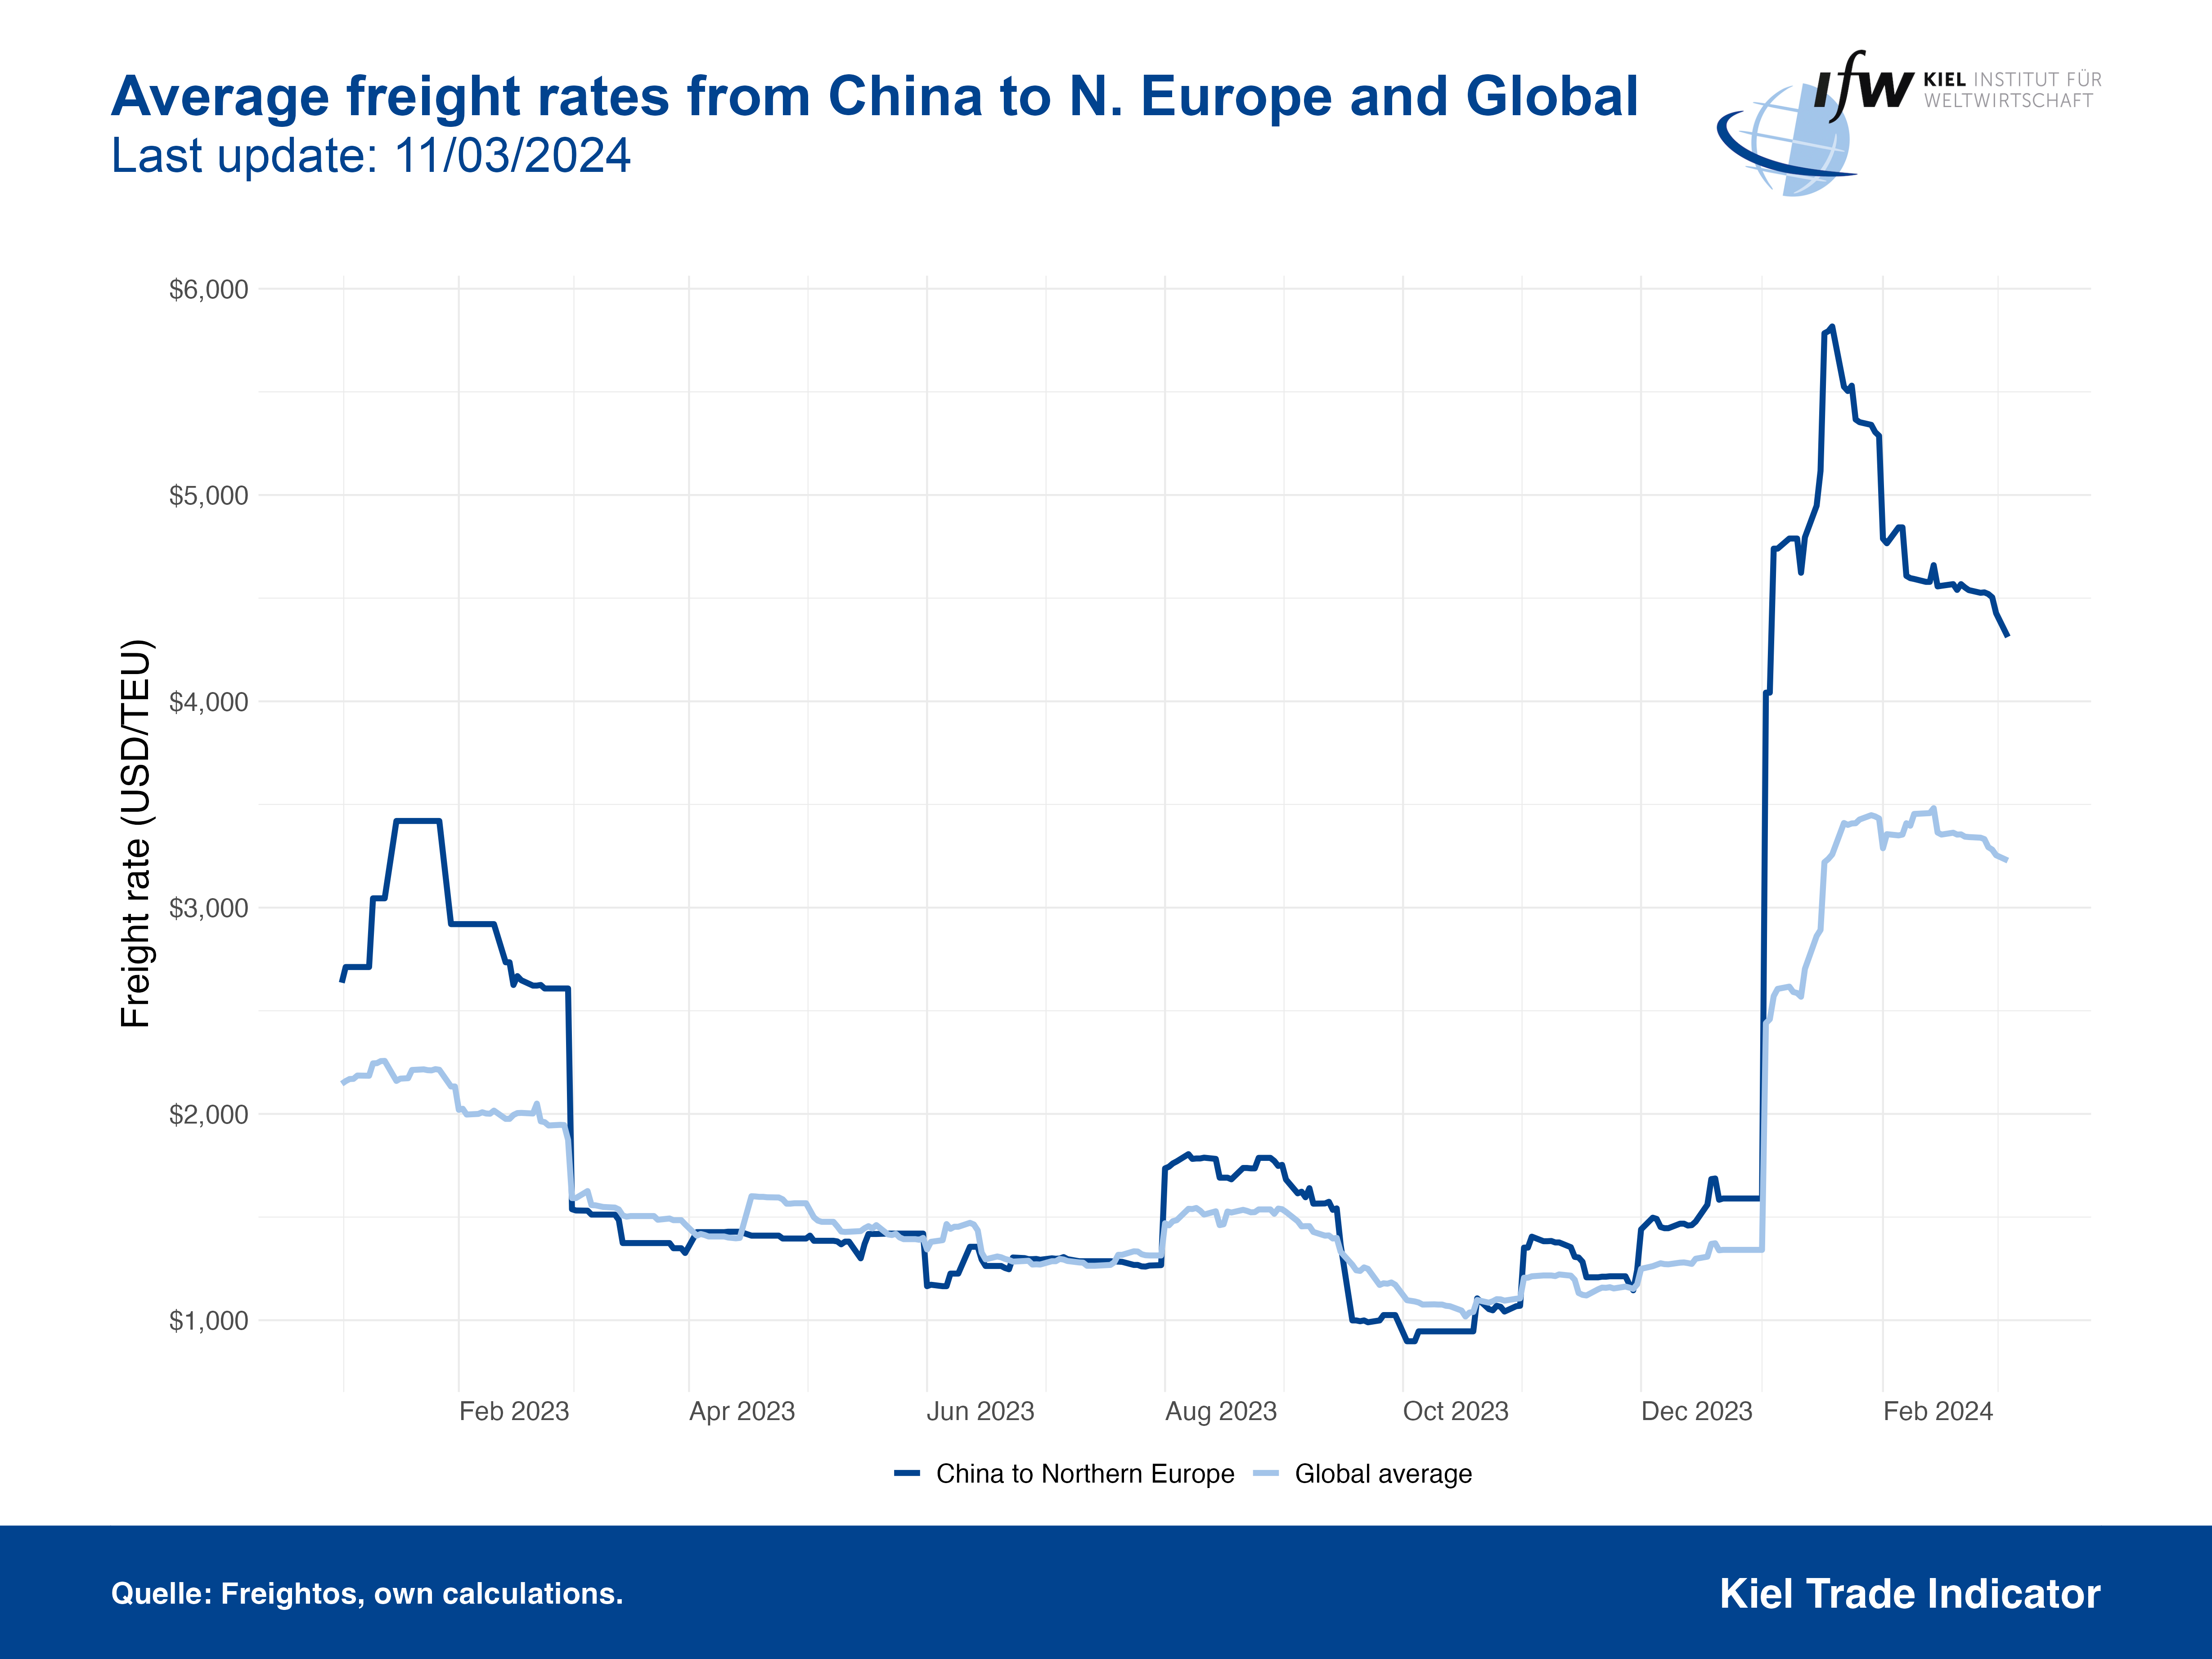
This graph shows the average freight rates from China to Northern Europe and the global average.
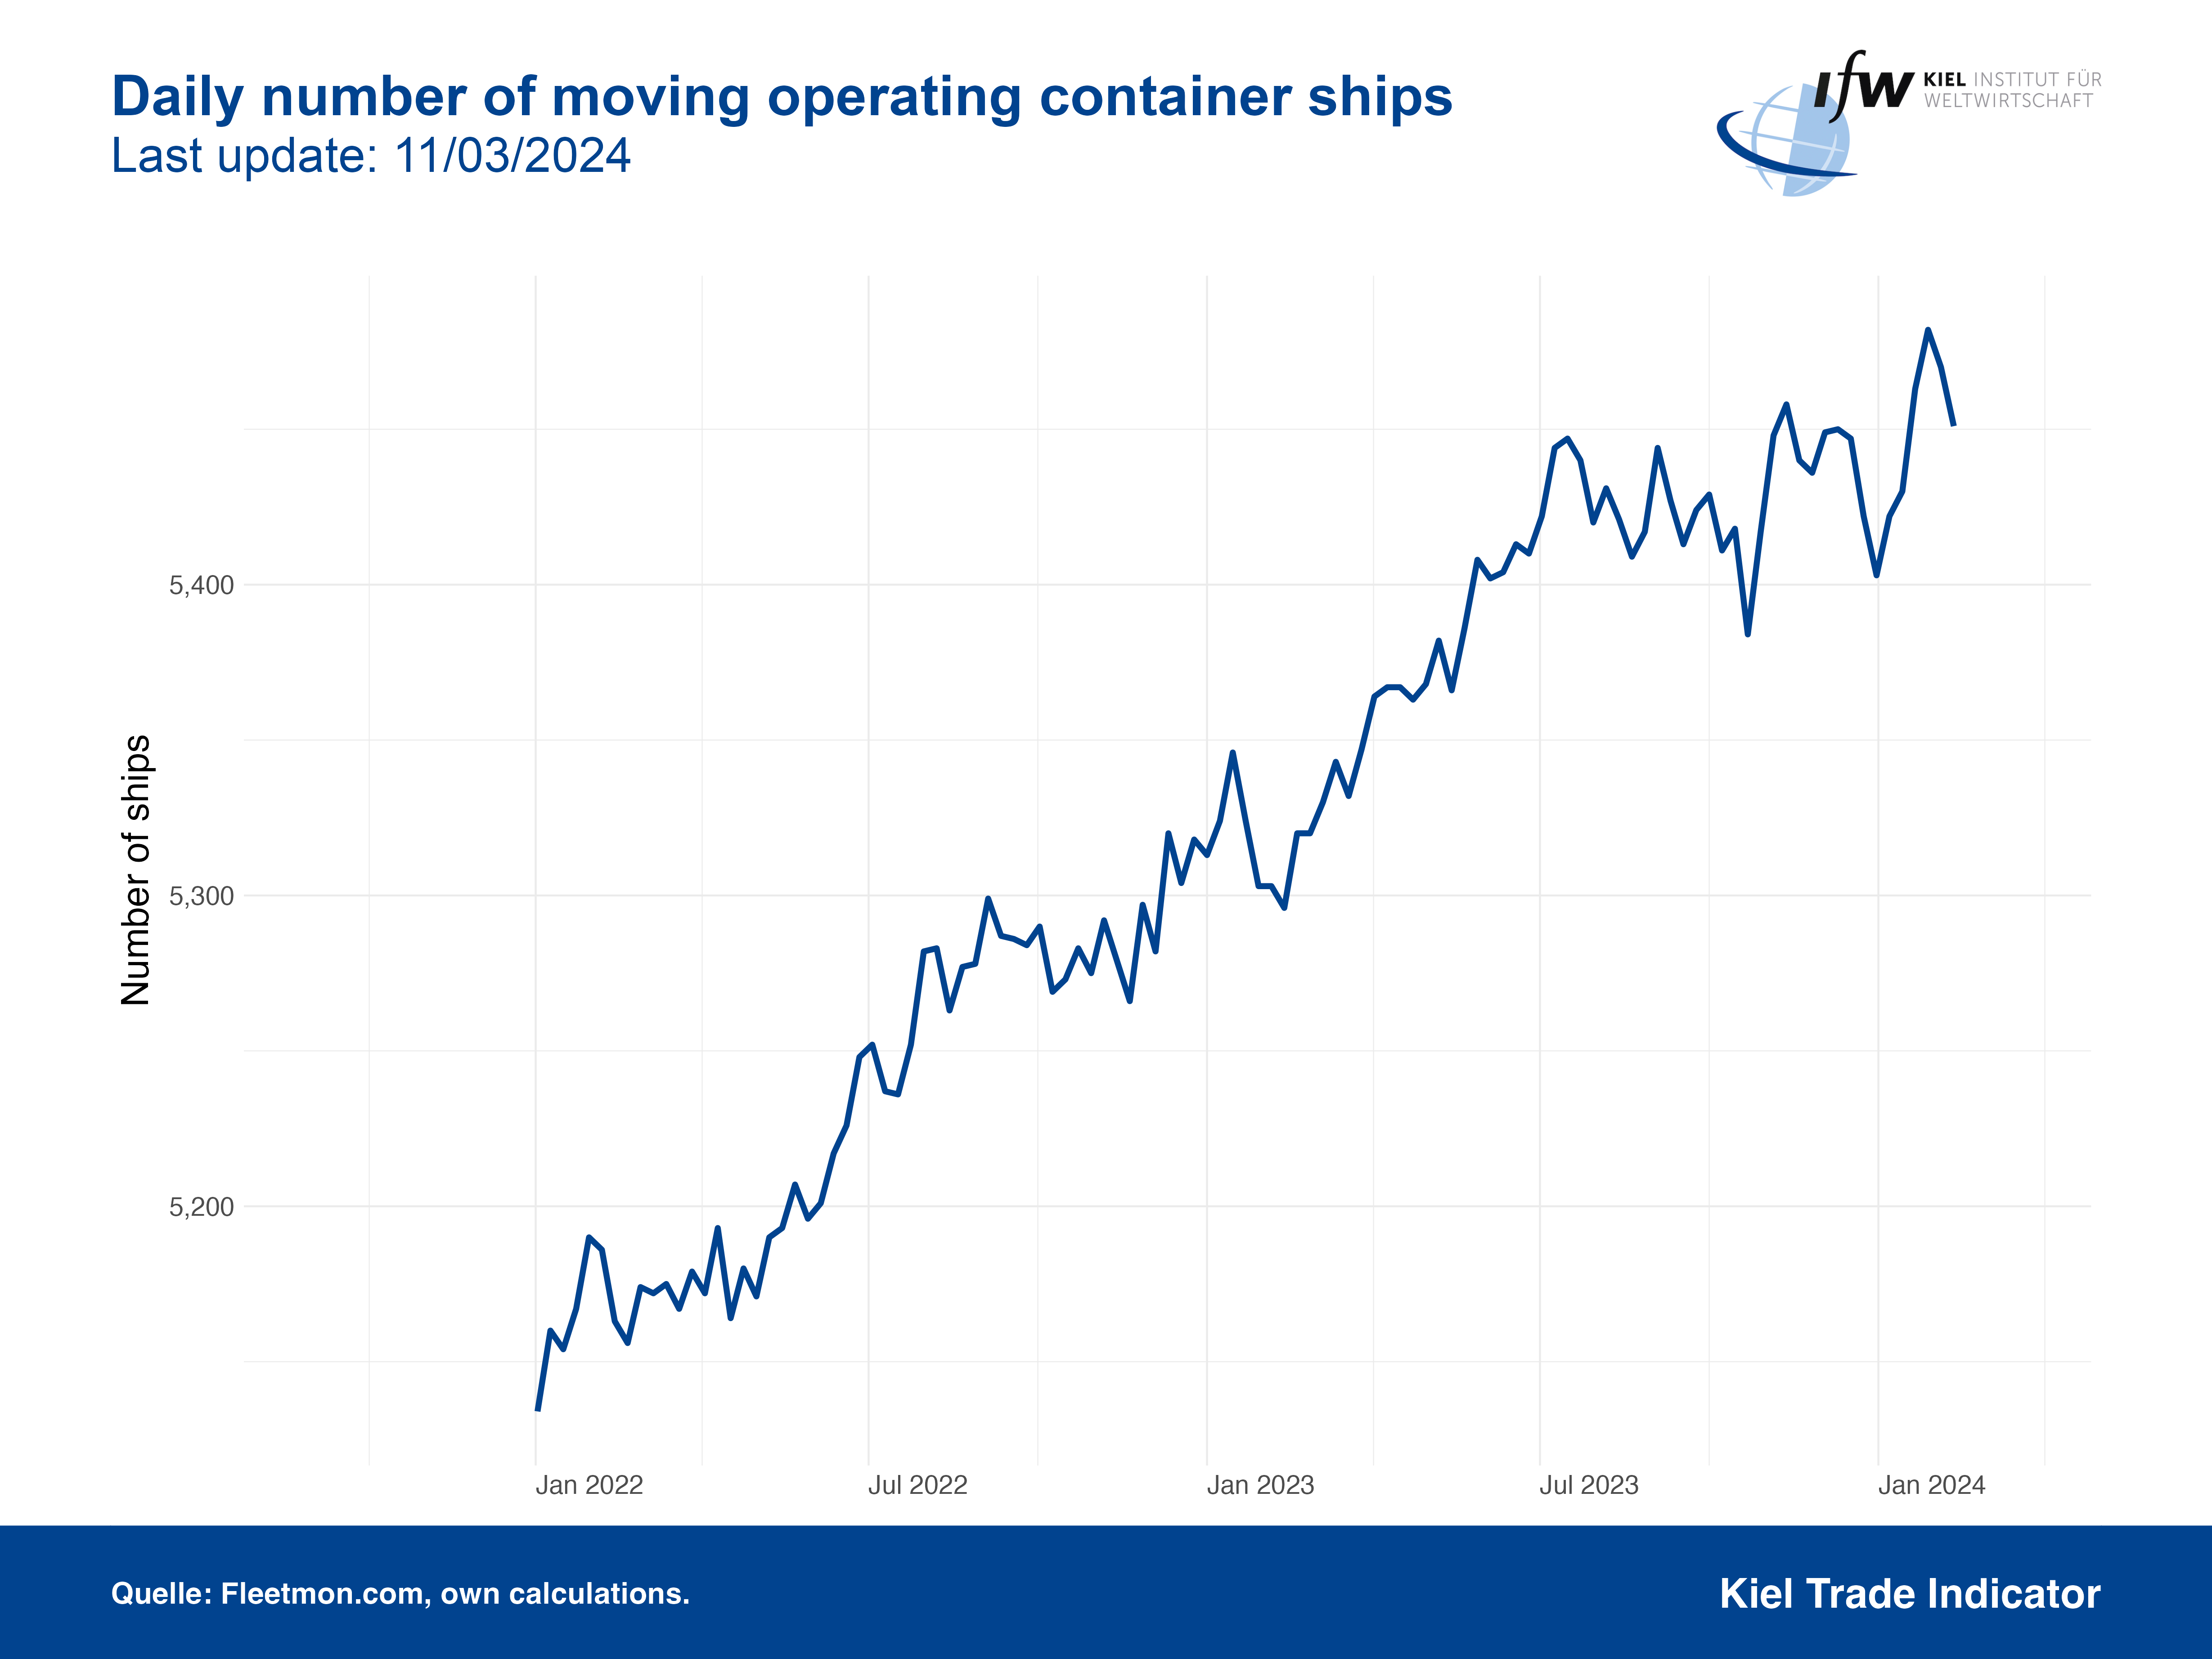
This graph shows the global number of moving operating container ships.
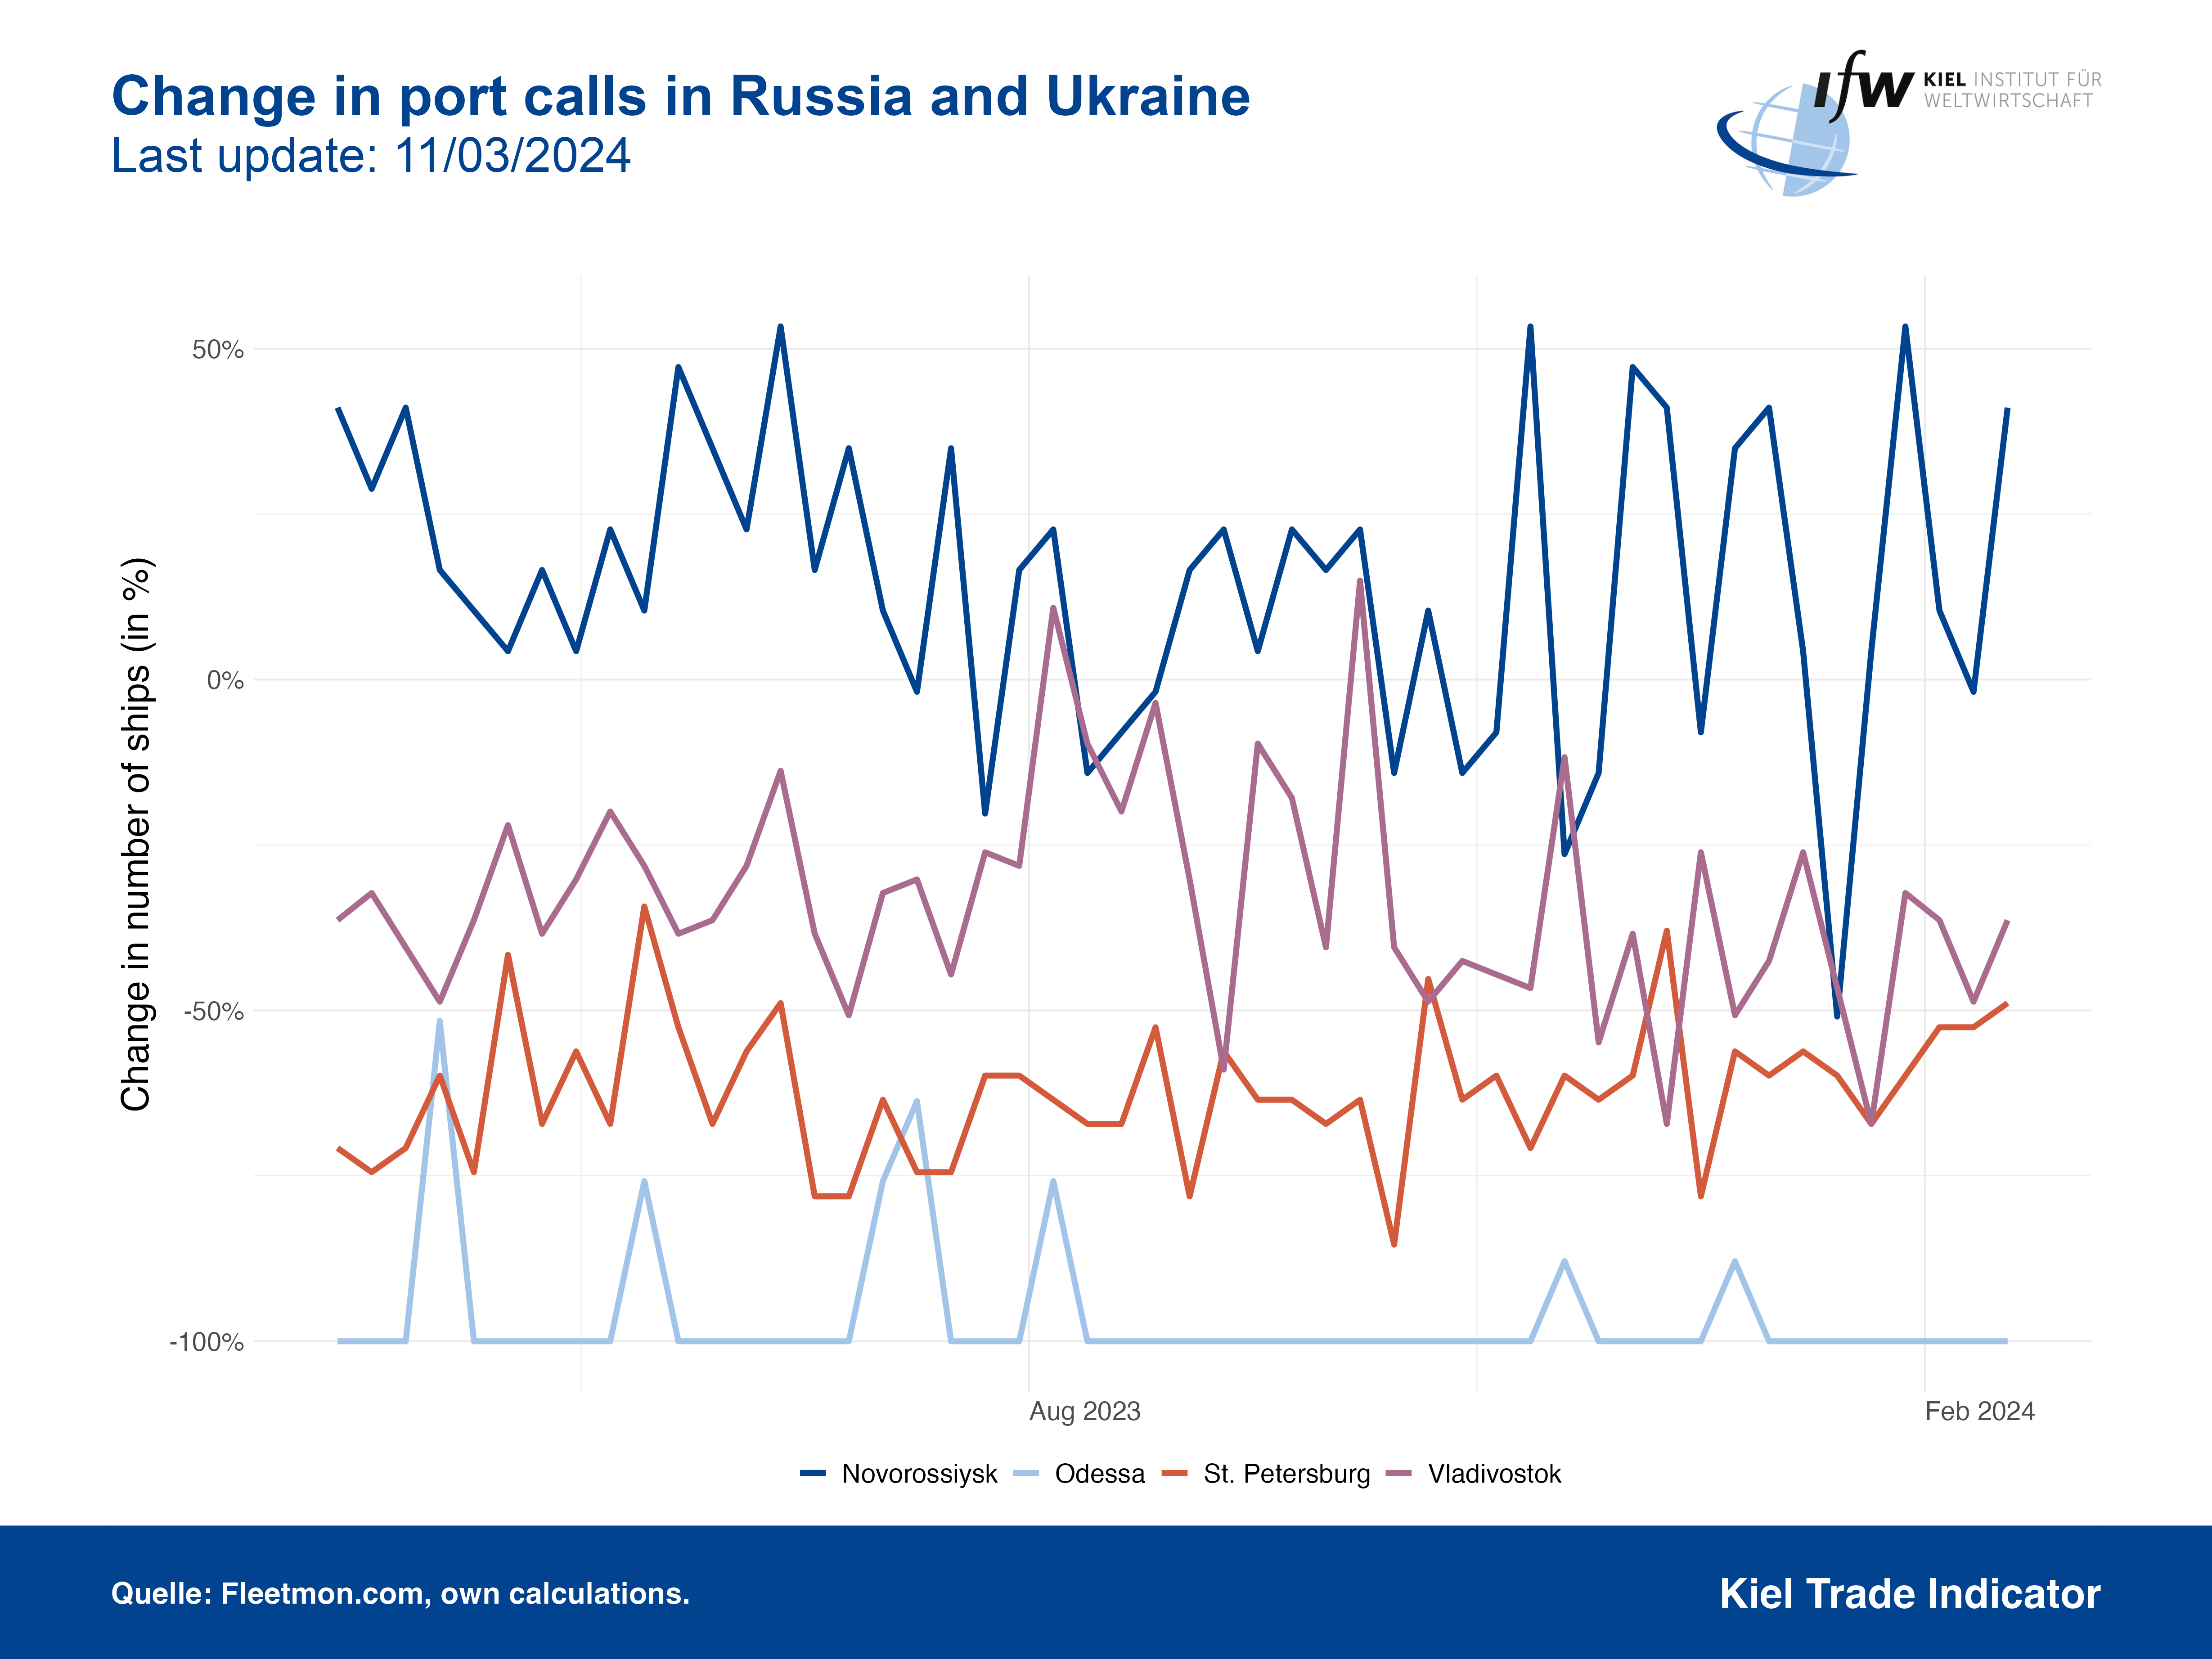
This graph shows the number of weekly port calls in Russia and Ukraine.
About the Kiel Trade Indicator
The Kiel Trade Indicator estimates trade flows (imports and exports) of 75 countries worldwide, the EU and world trade as a whole. Specifically, the estimates cover over 50 individual countries as well as regions such as the EU, sub-Saharan Africa, North Africa, the Middle East or emerging Asia. It is based on the evaluation of ship movement data in real time. An algorithm programmed at the Kiel Institute uses artificial intelligence to analyze the data and translates the ship movements into price and seasonally adjusted growth figures compared with the previous month.
We update the data once a month around the 5th and then present the latest calculations for trade in the current and the previous month.
Arriving and departing ships are recorded for 500 ports worldwide. In addition, ship movements in 100 maritime regions are analyzed and the effective utilization of container ships is derived from draught information. Country-port correlations can be used to generate forecasts, even for countries without their own deep-sea ports.
Compared to previous leading trade indicators, the Kiel Trade Indicator is available much earlier, is much more comprehensive, relies on a uniquely large database using big data, and has a low statistical error by comparison. The algorithm of the Kiel Trade Indicator uses machine learning, so that the quality of the forecast continues to improve over time.
Methodology of the Kiel Trade Indicator

Published in International Journal of Forecasting
The vessel data for the Kiel Trade Indicator is provided by FleetMon