Kiel Trade Indicator

The Kiel Trade Indicator estimates the trade flows (imports and exports) of 75 countries and regions worldwide, as well as world trade as a whole. The world map shows an expected increase (green) or decrease (red) for the individual countries. Clicking on a country opens a graph with more details. Estimated are the unilateral trade flows of a country with the rest of the world. The Kiel Trade Indicator is updated around the 5th of each month.

+++ Next data update: January 9, 2023 +++


Data update December 6, 2023

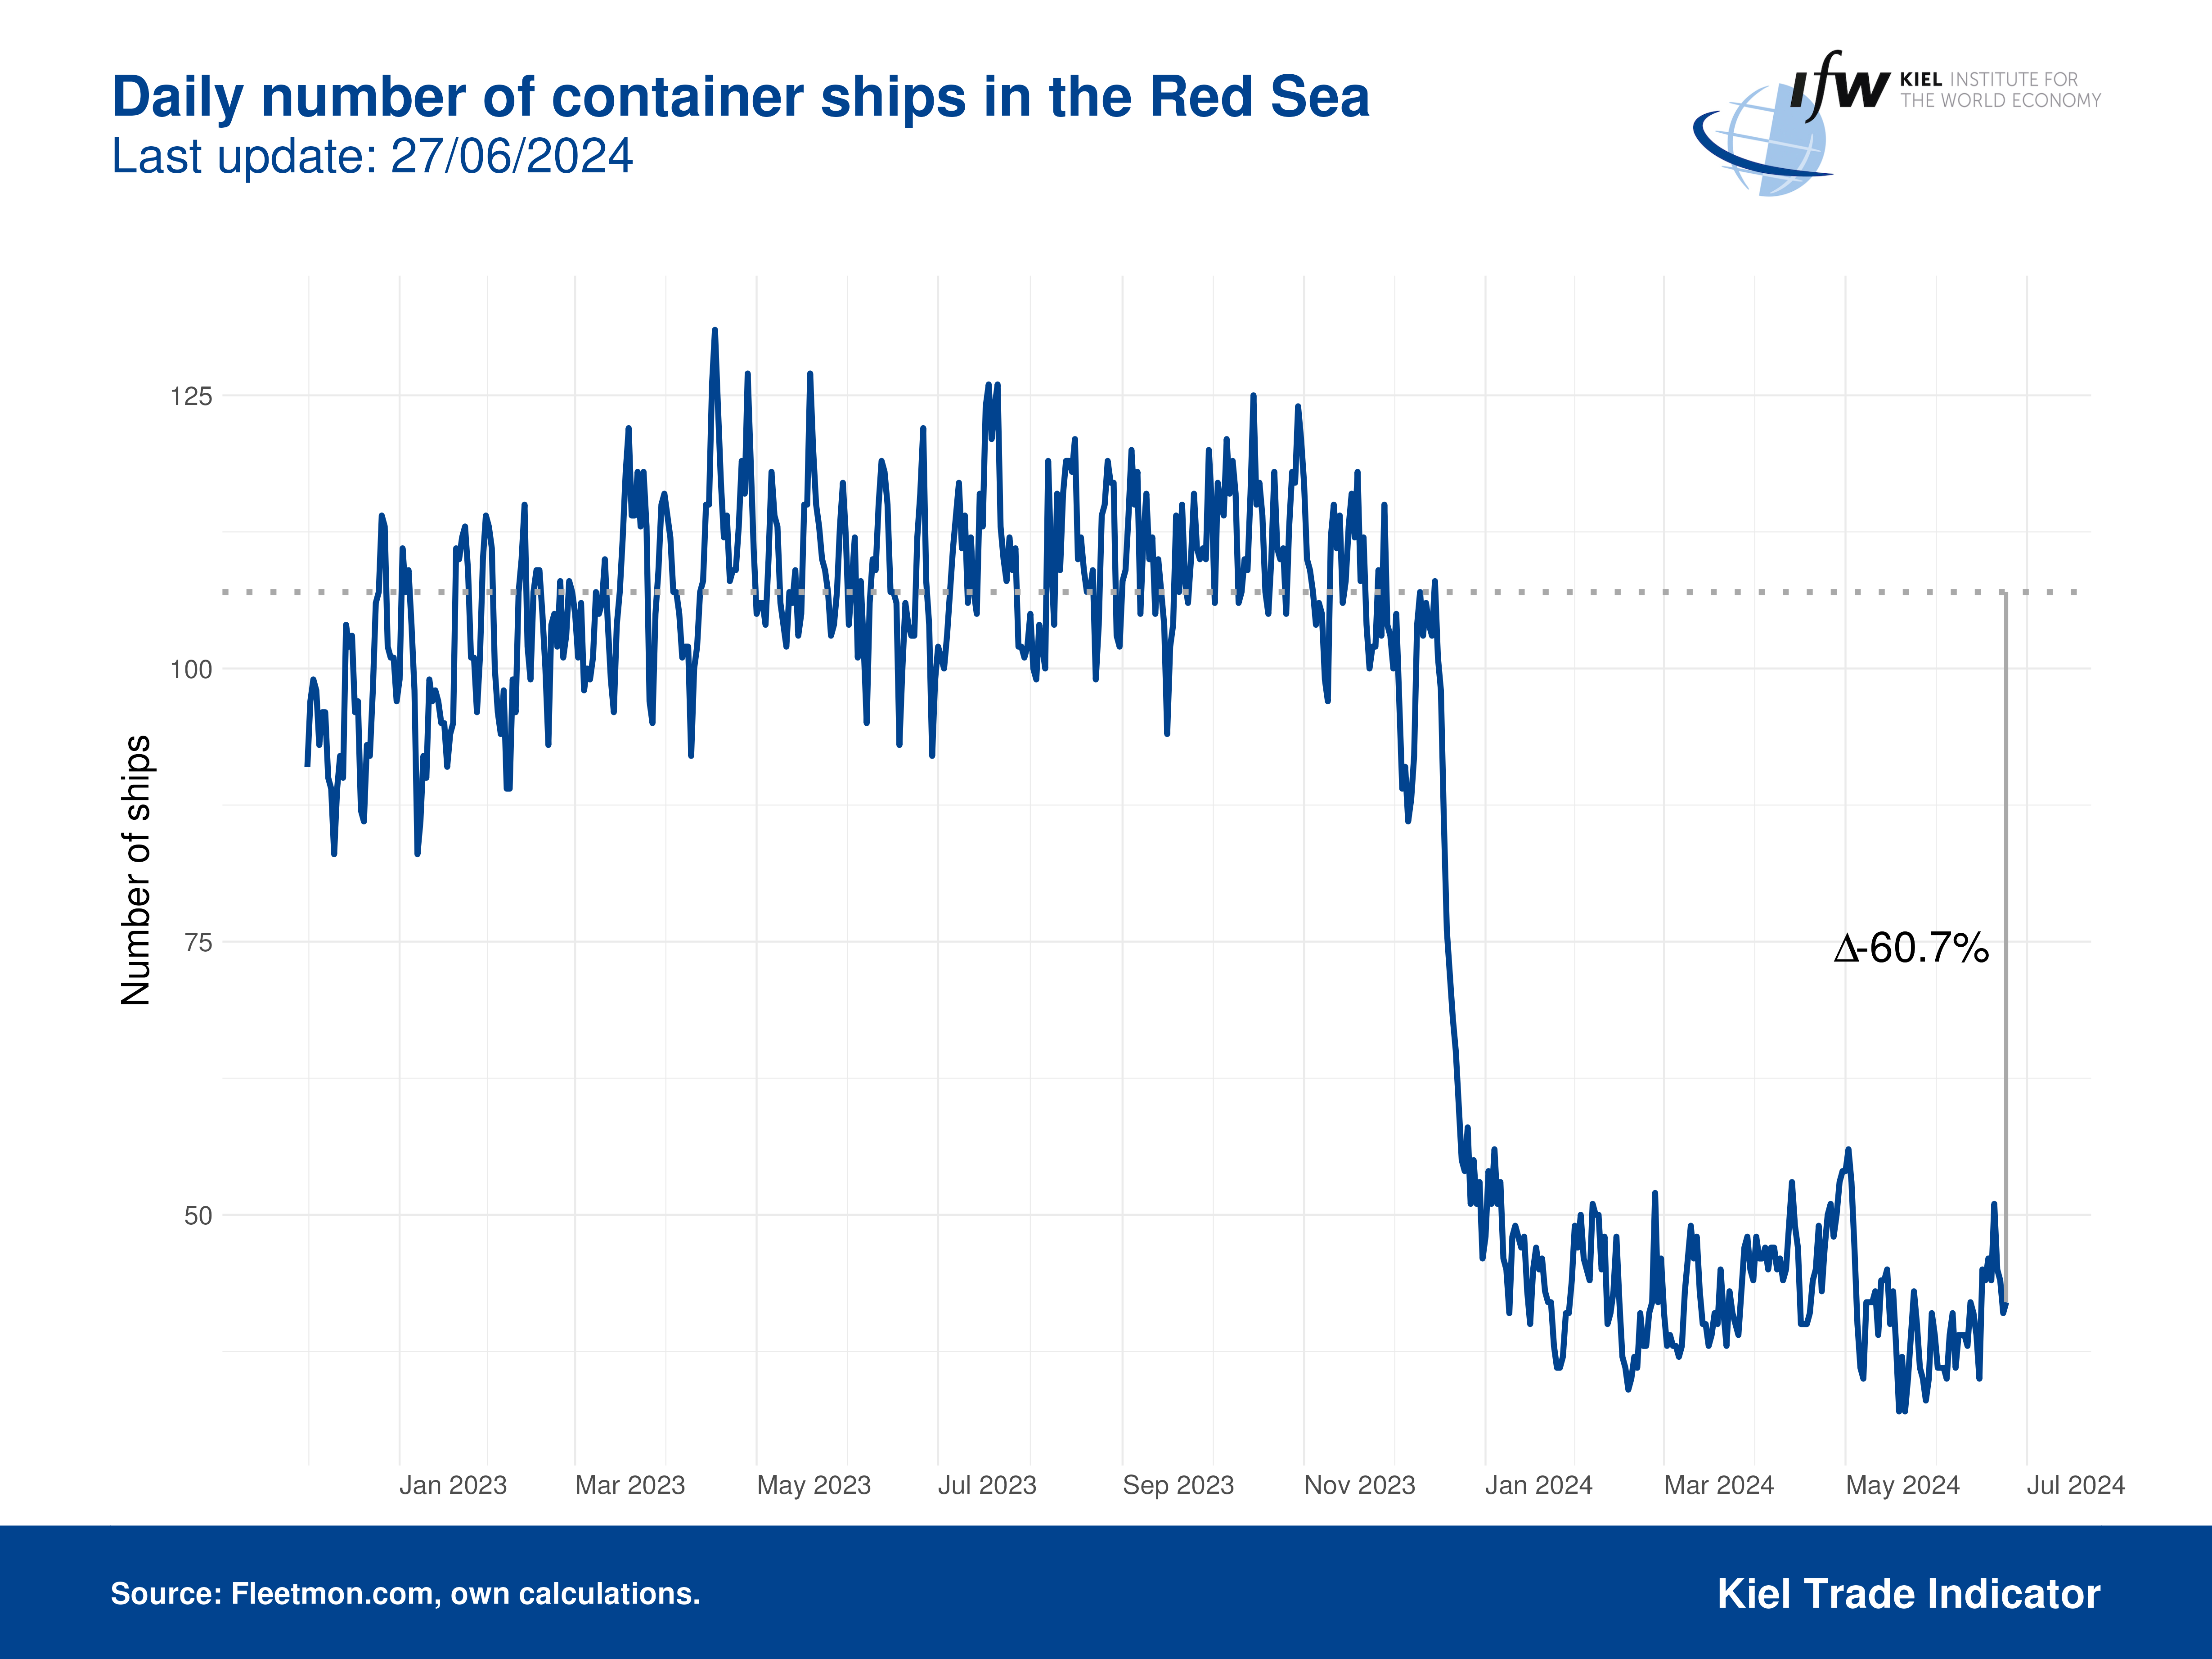
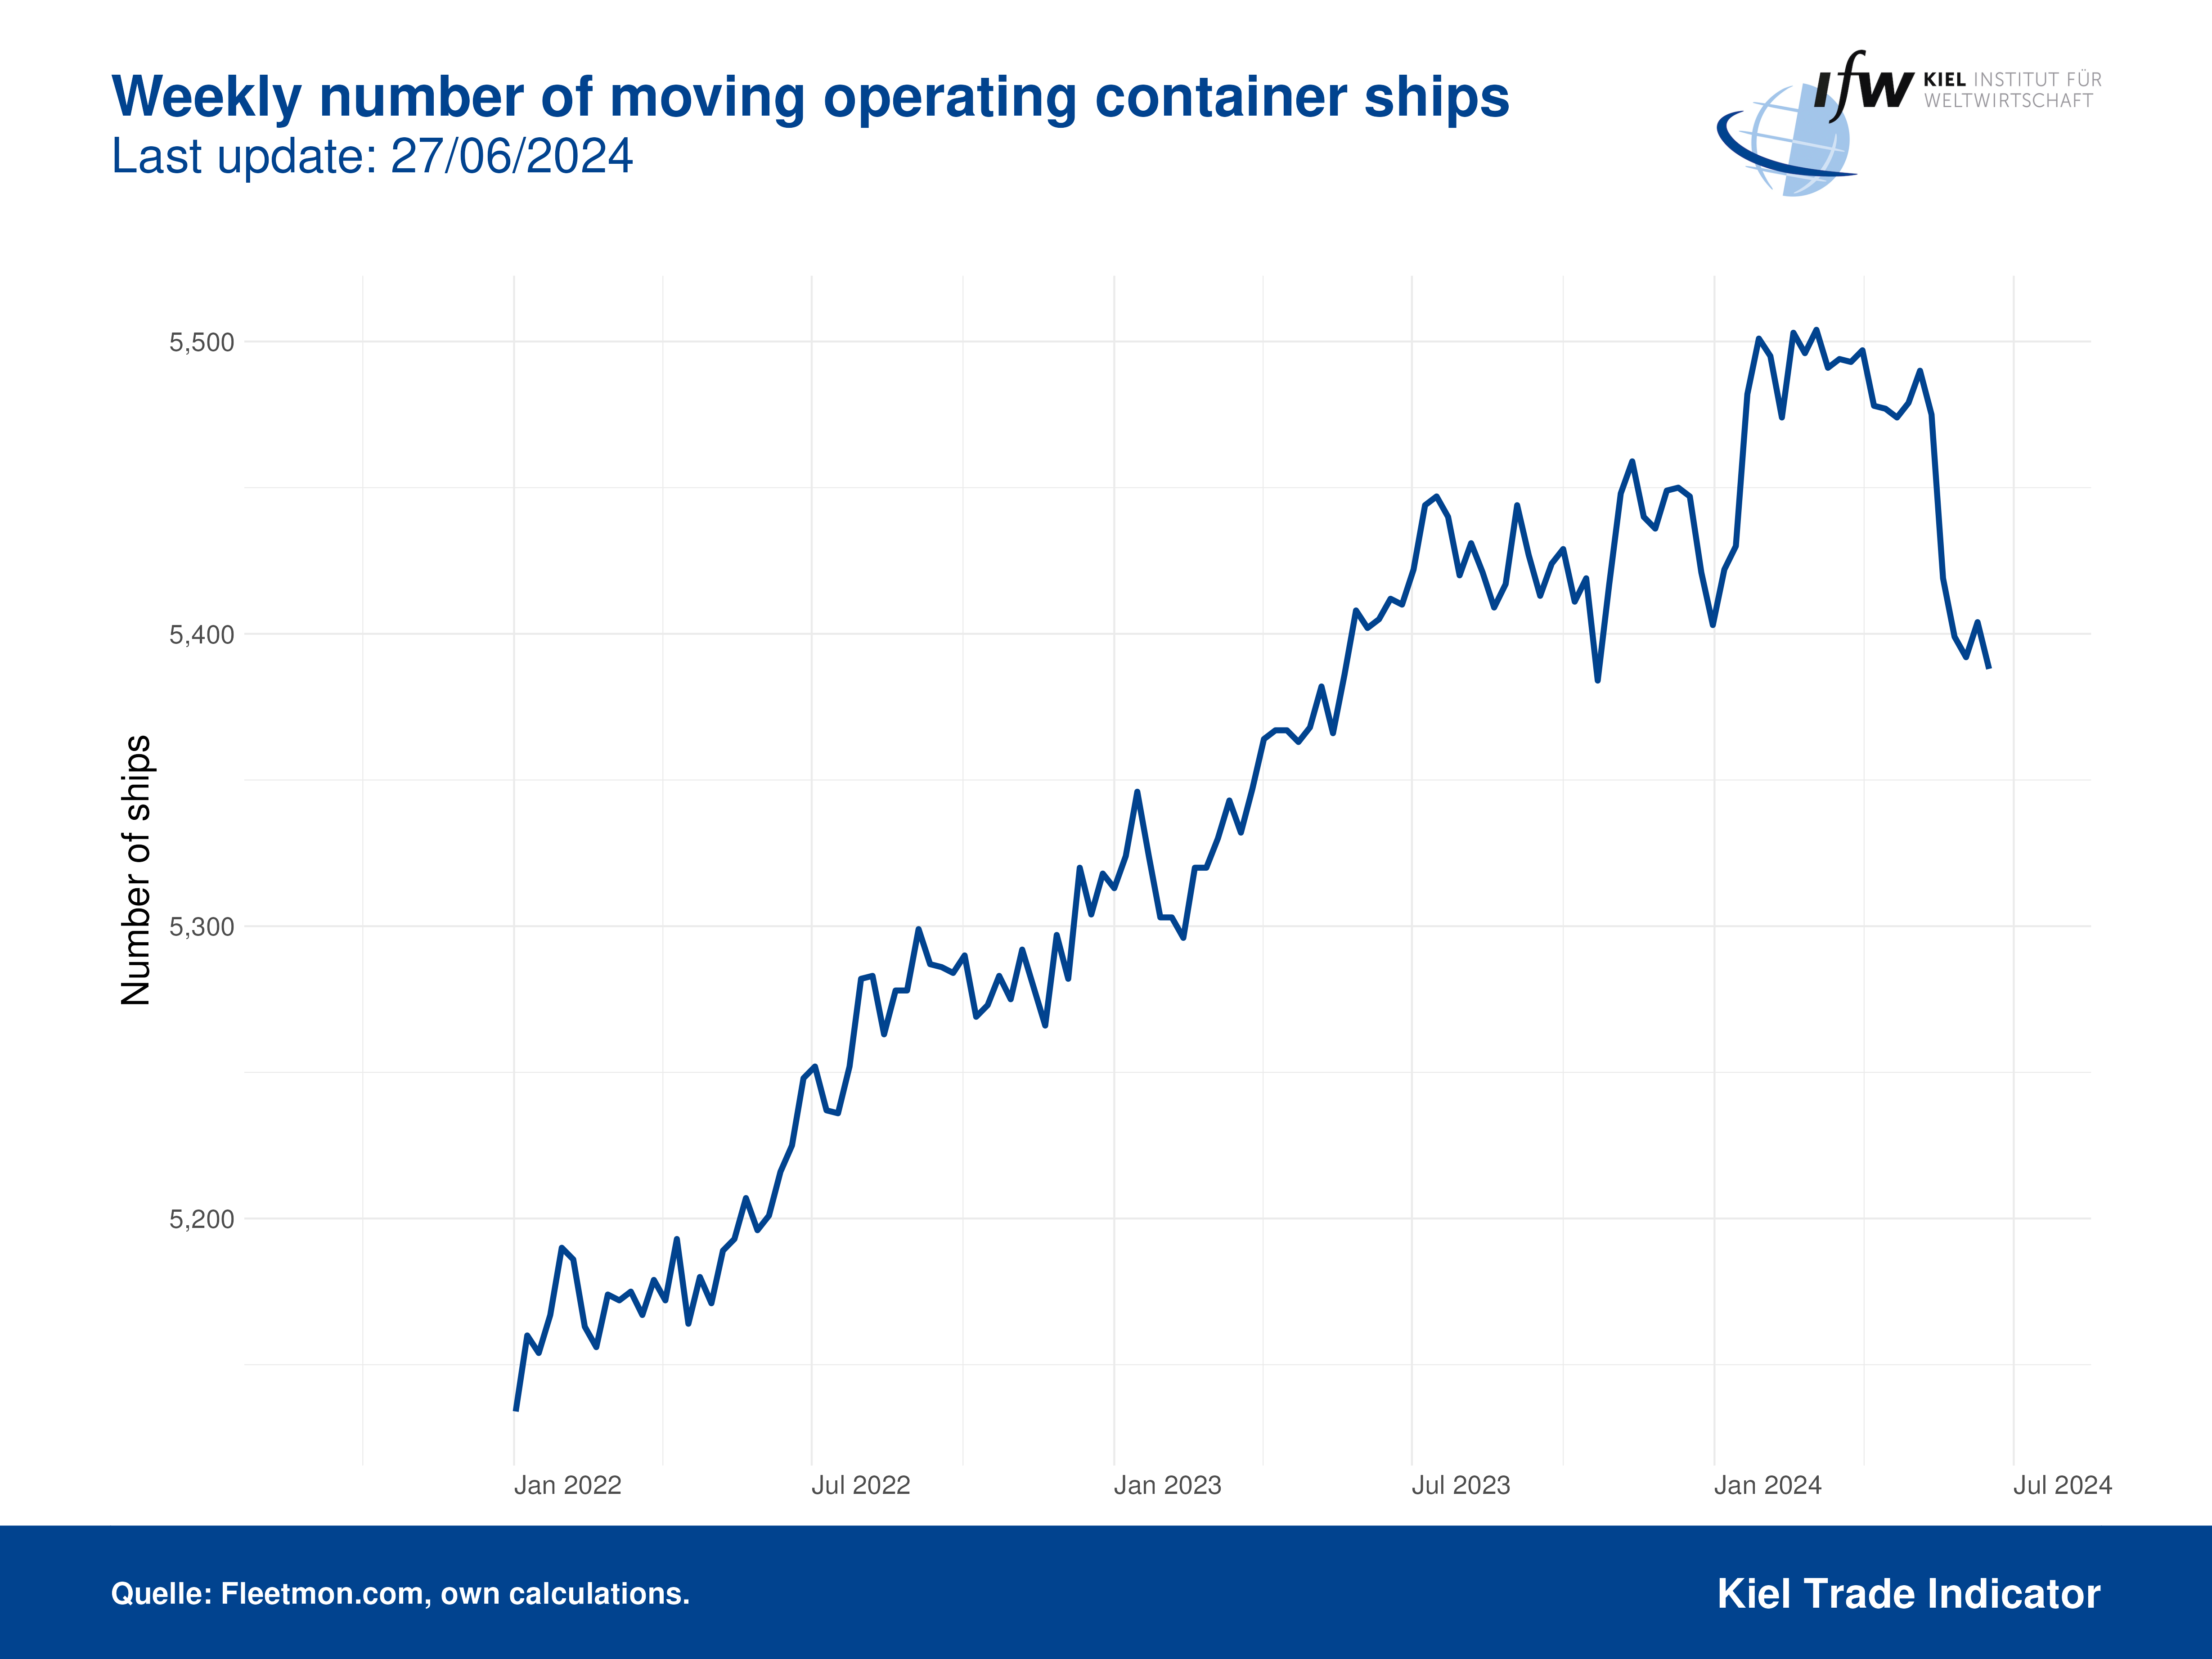
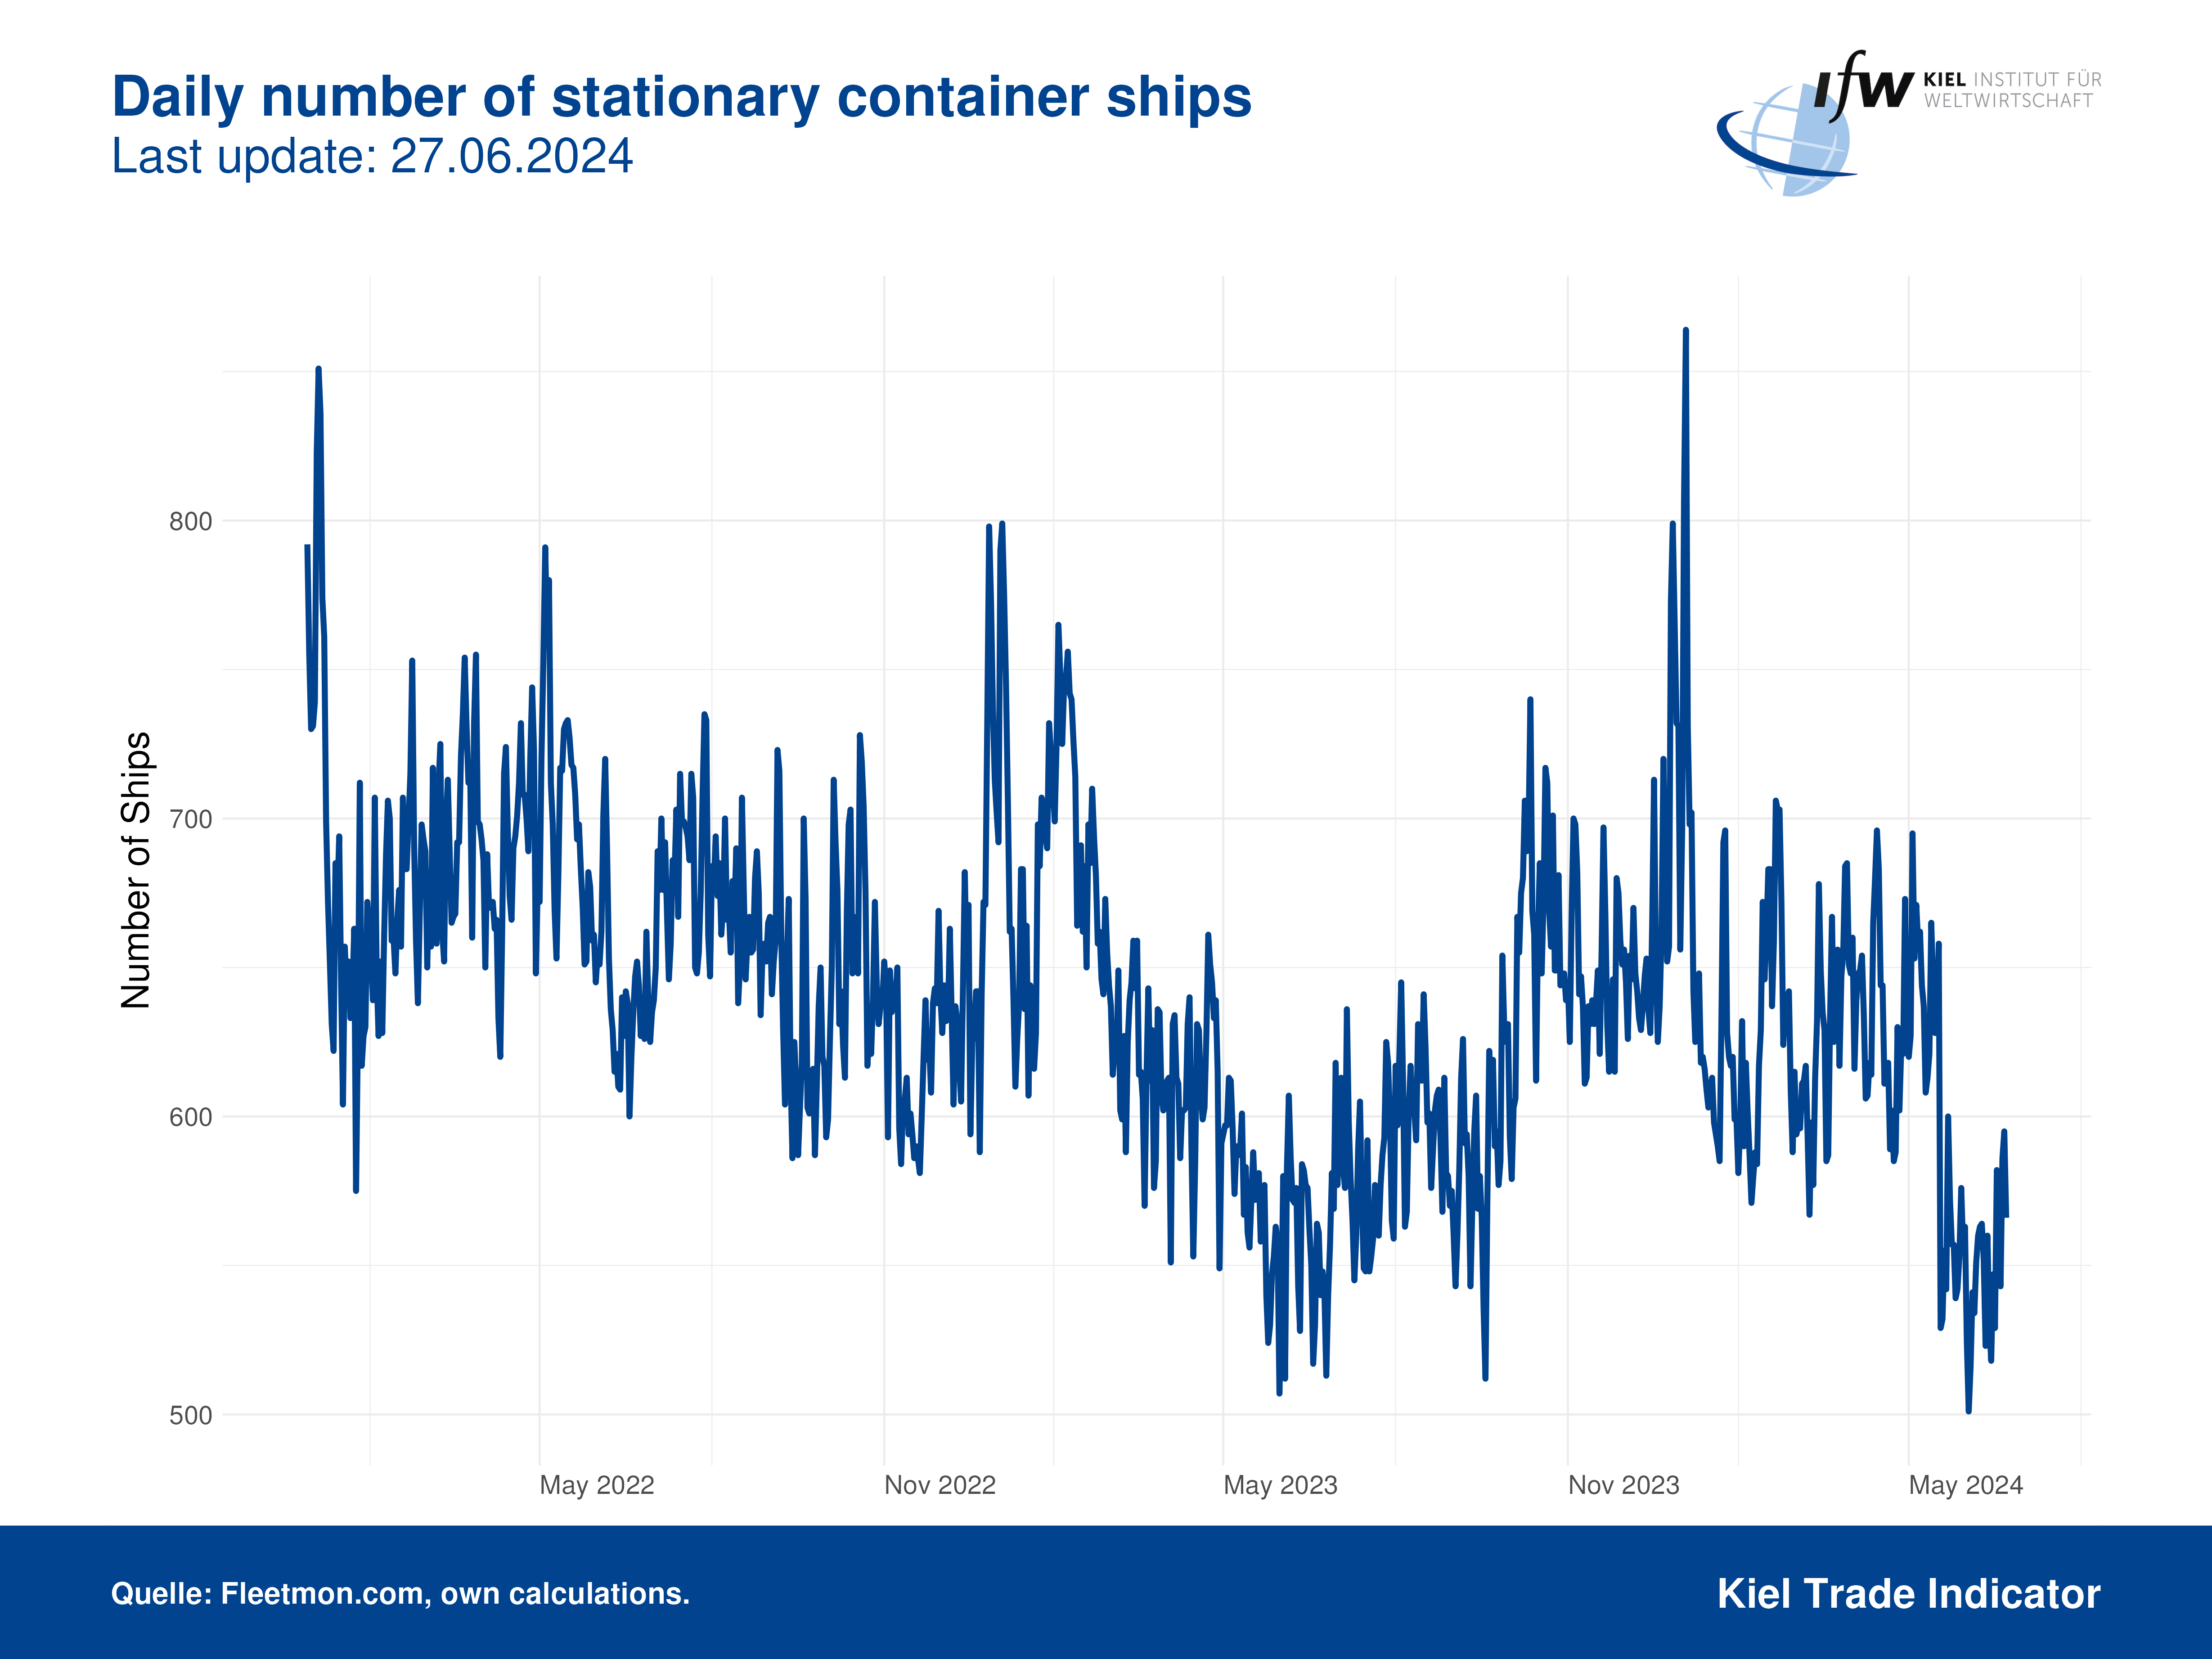
According to the latest update of the Kiel Trade Indicator, global trade declined in November compared to the previous month of October (price and seasonally adjusted). In line with the weak development, the volume of standard containers shipped has also fallen. German foreign trade in particular is following a sustained period of weakness. Shipping traffic in the Red Sea is well below the volume actually expected, which is primarily due to economic factors. The effects of the conflict in the Middle East are only likely to become apparent in the medium to long term. 

"Since the outbreak of the COVID-19 pandemic, German foreign trade has basically only been growing because prices are rising. Adjusted for inflation, exports and imports have been more or less flatlining for years," says Vincent Stamer, Head of Kiel Trade Indicator.

"According to Kiel Trade Indicator data, there is no improvement in sight in the short term. German foreign trade is unlikely to see any Christmas cheer due to the weak economy and high interest rates." 

Read more in our latest news: Global trade declines, Middle East conflict without acute impact on trade

November 2023*

  ExportImport
Germany + 0.7 %- 1.1 %
EU + 1.4 %+ 1.1 %
USA + 0.1 %+ 1.5 %
China + 0.6 %- 2.6 %
Global trade- 0.9 %  

*Change month-on-month, price and seasonally adjusted.

Ship Data

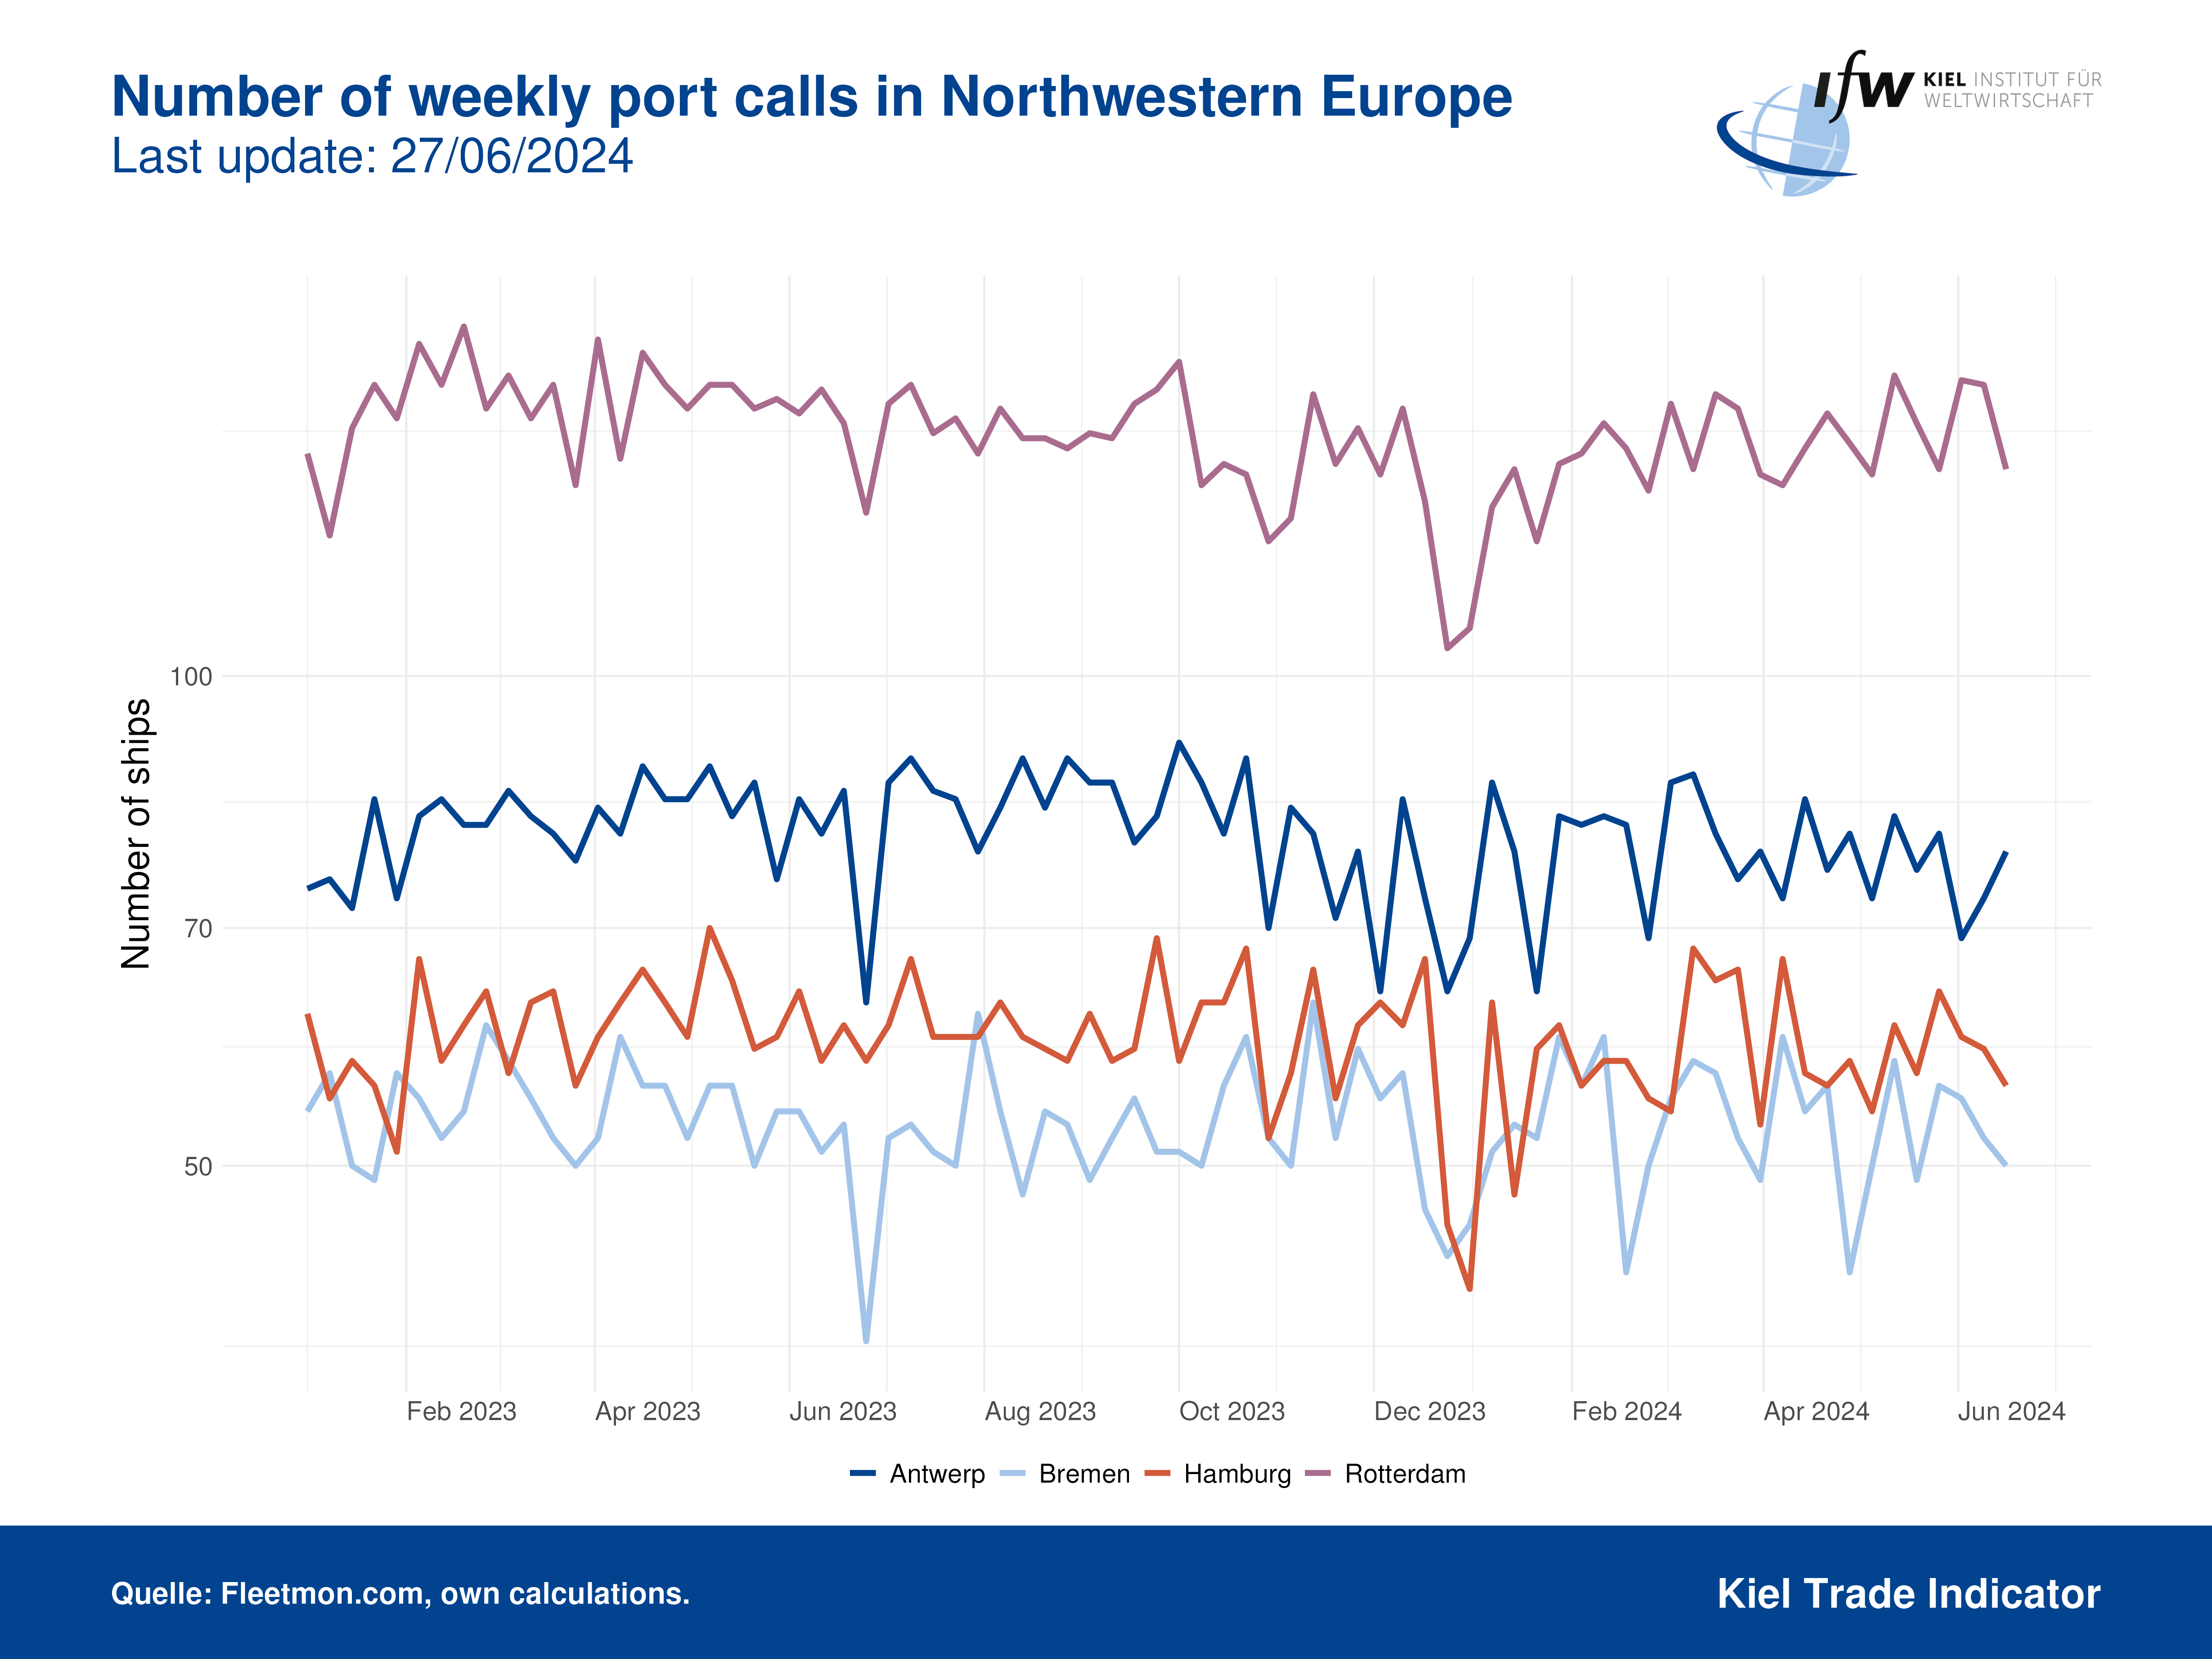
The graph shows what percentage of global container ship cargo capacity is tied up and unable to be loaded or unloaded due to congestion in sea areas up to 500 kilometers from major ports worldwide. Calculations are made using real-time vessel position data and takes into account the technically possible maximum capacity of the container ships. Regions include Georgia and South Carolina (ports of Savannah and Charleston), Southern California (ports of Los Angeles/ Long Beach and San Diego), Hong Kong and Guangdong (ports of HK, Yantian, Shenzhen and Guangzhou), Shanghai and Zhejiang (esp. Shanghai, Ningbo-Zhoushan), North Sea (North Sea ports of the Netherlands, Belgium, Germany and the UK).

The graph indicates the proportion of goods that are on waiting container ships. Calculations are made using real-time global vessel position data and include effective utilization of container ships from draught information.

The figure shows the estimated global containerized freight volume per month in Million TEU (Twenty-Foot Equivalent Unit). The time series is based on ship movements at over 1,200 ports worldwide and at sea and is seasonally adjusted.

The graph measures the summed capacity of container ships in the Red Sea and the Suez Canal on a daily basis. Due to the particular geographical location of the Red Sea, the shipping here reflects the trading activity between Europe and Asia. The expected value is calculated from the average of 2017 to 2019, scaled to 2020 and 2021 using past growth rates.

The graph shows the arriving container loads in comparison to the previous year at the three largest container ports of Russia (St. Petersburg at the Baltic Sea, Novorossiysk at the Black Sea, as well as Vladivostok at the Pacific) and the largest port of Ukraine, Odessa. The reductions of trade volumes are the result of the war in the Ukraine and sactions against Russia. The calculation employs container ship poitions data and takes the size and draught of the ship into consideration.


About the Kiel Trade Indicator

The Kiel Trade Indicator estimates trade flows (imports and exports) of 75 countries worldwide, the EU and world trade as a whole. Specifically, the estimates cover over 50 individual countries as well as regions such as the EU, sub-Saharan Africa, North Africa, the Middle East or emerging Asia. It is based on the evaluation of ship movement data in real time. An algorithm programmed at the Kiel Institute uses artificial intelligence to analyze the data and translates the ship movements into price and seasonally adjusted growth figures compared with the previous month.

We update the data once a month around the 5th and then present the latest calculations for trade in the current and the previous month.

Arriving and departing ships are recorded for 500 ports worldwide. In addition, ship movements in 100 maritime regions are analyzed and the effective utilization of container ships is derived from draught information. Country-port correlations can be used to generate forecasts, even for countries without their own deep-sea ports.

Compared to previous leading trade indicators, the Kiel Trade Indicator is available much earlier, is much more comprehensive, relies on a uniquely large database using big data, and has a low statistical error by comparison. The algorithm of the Kiel Trade Indicator uses machine learning, so that the quality of the forecast continues to improve over time.

Methodology of the Kiel Trade Indicator