News
World trade starts recovery
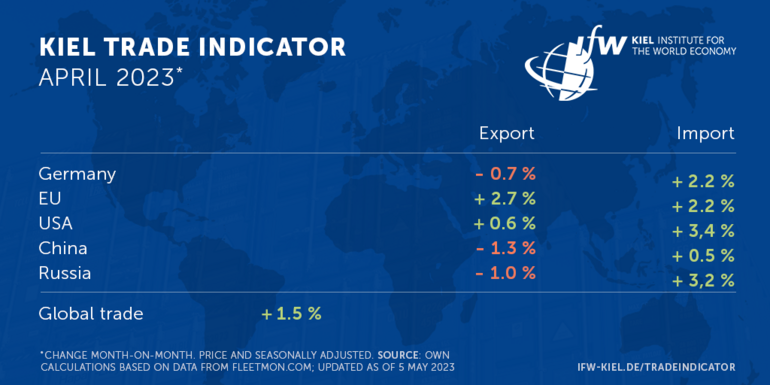
According to the latest Kiel Trade Indicator data update for April, global trade is expected to increase by 1.5 percent month-on-month (adjusted for price and seasonal effects).
The driving force behind the increase is primarily the positive EU trade figures for both exports (+2.7 percent) and imports (+2.2 percent). "Intra-European trade in particular is benefiting, as is France's trade in goods. But also neighbors outside the single market such as the United Kingdom, Norway, and Switzerland display a positive development in April," says Vincent Stamer, Head of Kiel Trade Indicator.
For Germany, the Kiel Trade Indicator paints a less clear picture, with only imports (+2.2 percent) showing an upward trend, while exports (-0.7 percent) are negative.
In US trade, despite a very weak March, no counterimpulse can be seen in the indicator values for exports (+0.6 percent) in April. Imports (+3.4 percent), however, are likely to make up lost ground.
In China, the Kiel Trade Indicator points slightly downward for exports (-1.3 percent) and sideways for imports (+0.5 percent) after a negative winter half-year. "Apparently, the economic recovery after the end of the zero-COVID policy leads to higher domestic consumption, but currently not to increased foreign trade," Stamer said.
Cargo volume in the Red Sea increases significantly
The evaluation of freight volumes on the world's oceans confirms the overall more positive picture for global merchandise trade in April.
In the Red Sea—the most important maritime trade route between Europe and Asia—the 600,000 standard containers shipped per day mark was exceeded in April for the first time since the traffic jam during the Ever Given accident in the Suez Canal two years ago.
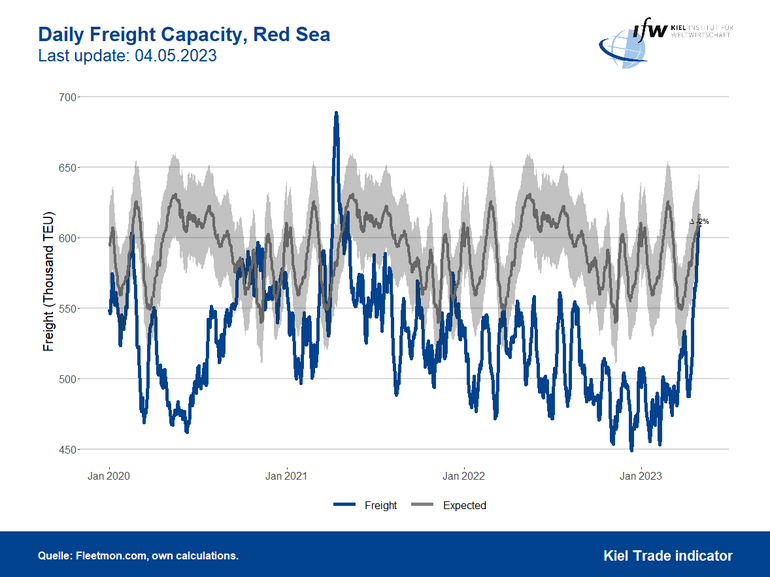
This closes the gap between actual and expected freight volumes—calculated from average trade volumes from 2017 to 2019.
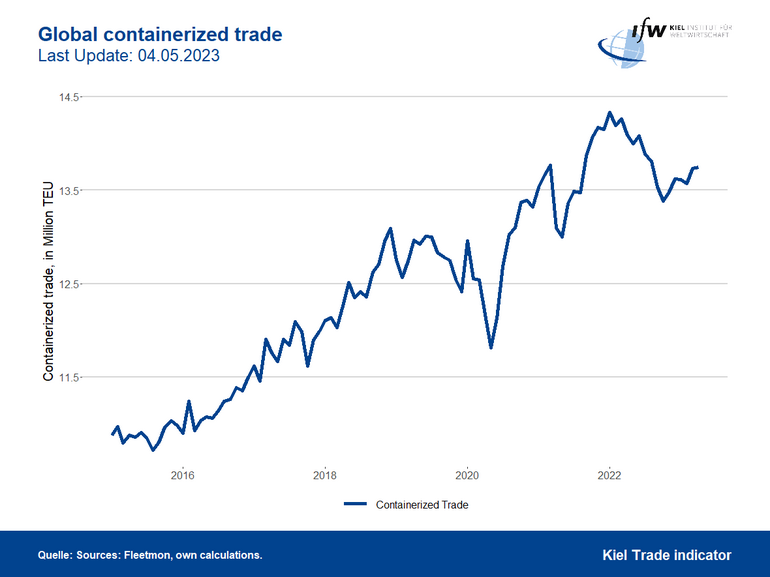
The volume of standard containers shipped worldwide also rose again slightly in April to almost 14 million units per day, confirming the upward trend of recent weeks. Since the start of the weak winter phase in October 2022, the volume of goods shipped globally in containers has recovered by around 3 percent.
For more information on the Kiel Trade Indicator and forecasts for 75 countries and regions, visit www.ifw-kiel.de/tradeindicator.
The next update of the Kiel Trade Indicator will take place on May 22 (without media information) and on June 6 (with media information) for May trade data.

About the Kiel Trade Indicator
The Kiel Trade Indicator estimates trade flows (imports and exports) of 75 countries and regions worldwide, the EU and world trade as a whole. Specifically, the estimates cover over 50 individual countries as well as regions such as the EU, sub-Saharan Africa, North Africa, the Middle East or emerging Asia. It is based on the evaluation of ship movement data in real time. An algorithm programmed at the Kiel Institute uses artificial intelligence to analyze the data and translates the ship movements into price and seasonally adjusted growth figures compared with the previous month.
We update the data twice a month. Around the 20th (without press release) for the current and the following month and around the 5th (with press release) for the previous and the current month.
Arriving and departing ships are recorded for 500 ports worldwide. In addition, ship movements in 100 maritime regions are analyzed and the effective utilization of container ships is derived from draught information. Country-port correlations can be used to generate forecasts, even for countries without their own deep-sea ports.
Compared to previous leading trade indicators, the Kiel Trade Indicator is available much earlier, is much more comprehensive, relies on a uniquely large database using big data, and has a low statistical error by comparison. The algorithm of the Kiel Trade Indicator uses machine learning, so that the quality of the forecast continues to improve over time.