News
World Trade Stagnates, but more Container on the Move at Sea Again
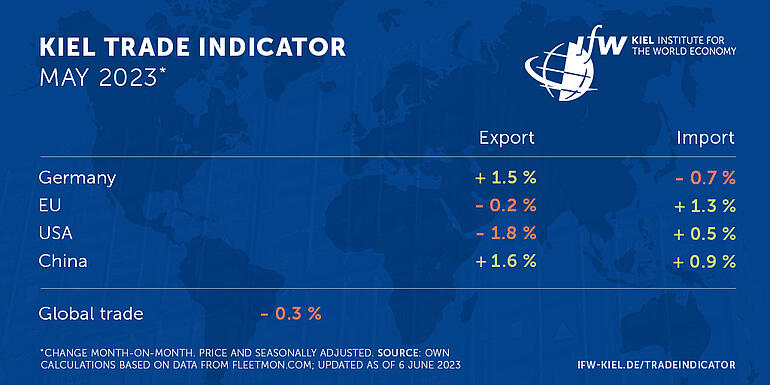
The latest Kiel Trade Indicator data for May show a 0.3 percent decline in world trade compared with theprevious month of April (price and seasonally adjusted).
For Germany, the Kiel Trade Indicator shows an increase in exports (+1.5 percent) and a decrease in imports (-0.7 percent). The EU figurespoint to a red zero for exports (-0.2 percent) and an increase for imports (+1.3 percent).
In US trade, a month-on-month decline in exports (-1.8 percent) and a small increase (+0.5 percent) in imports are reported. The figures for China are inthe green for both exports (+1.6 percent) and imports (+0.9 percent).
"Both overall global trade and the trade of major economies developed more or less sideways in May. Hence, the big recovery after the global cyclical weakness in the past winter half-year is still put on hold. Adjusted for the substantial price movements, German exports have now been running sideways for around two years," says Vincent Stamer, Head of Kiel Trade Indicator.
Trade with China is increasingly becoming a burden for German exports. The export value of German goods to China fell by 4 percent in the period from January to April compared with the same period last year, despite strong recent trade figures. According to the Chinese Statistics Authority, exports from other nations to the People's Republic have fallen even more seriously in some cases: Exports from Japan to China fell by more than 18 percent, and those from the United Kingdom by about 17 percent. The United States exported 2 percent less.
"Trade statistics show that China is increasingly replacing imports from industrialized countries with its own production. This is a negative impulse for global trade. A bright spot for the global exchange of goods is the slight positive trend in global container trade since the beginning of the year, as well as the accompanying easing of shipping congestion," says Stamer.
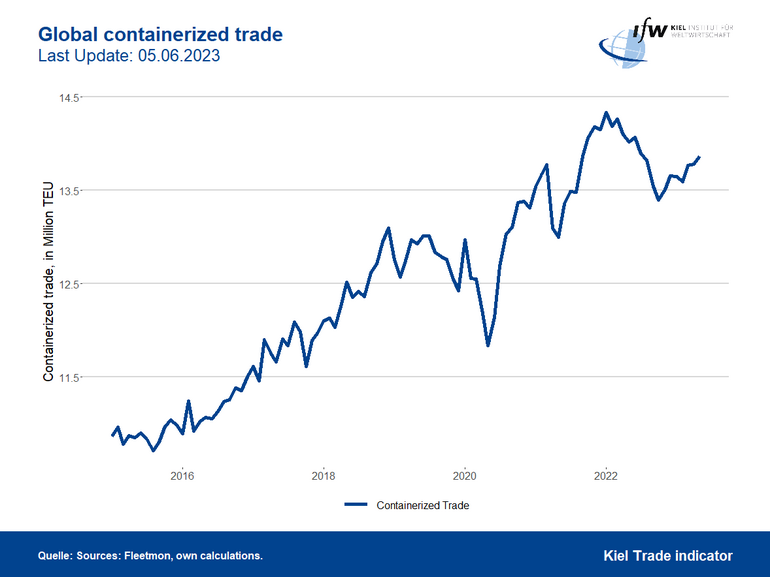
The trend in global container trade has been pointing upwards for a good 6 months and the volume of containers shipped has been increasing to 13.9 million standard containers, although this represents more than 1 percent fewer containers shipped in May than a year ago.
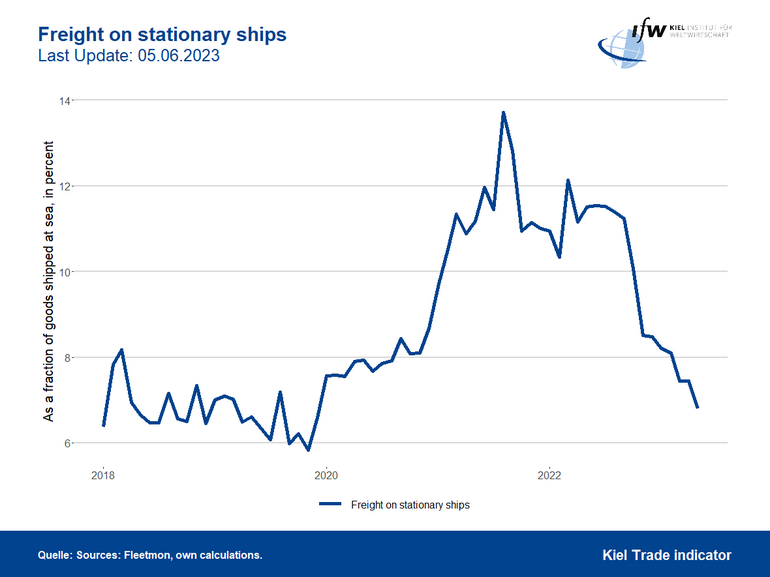
Globally, only 6.8 percent of all shipped goods are still in congestion, matching the average of the years before the pandemic.
For more information on the Kiel Trade Indicator and forecasts for 75 countries and regions, visit www.ifw-kiel.de/tradeindicator.
The next update of the Kiel Trade Indicator will take place on June 20 (without media information) and on July 5 (with media information) for June trade data.

About the Kiel Trade Indicator
The Kiel Trade Indicator estimates trade flows (imports and exports) of 75 countries and regions worldwide, the EU and world trade as a whole. Specifically, the estimates cover over 50 individual countries as well as regions such as the EU, sub-Saharan Africa, North Africa, the Middle East or emerging Asia. It is based on the evaluation of ship movement data in real time. An algorithm programmed at the Kiel Institute uses artificial intelligence to analyze the data and translates the ship movements into price and seasonally adjusted growth figures compared with the previous month.
We update the data twice a month. Around the 20th (without press release) for the current and the following month and around the 5th (with press release) for the previous and the current month.
Arriving and departing ships are recorded for 500 ports worldwide. In addition, ship movements in 100 maritime regions are analyzed and the effective utilization of container ships is derived from draught information. Country-port correlations can be used to generate forecasts, even for countries without their own deep-sea ports.
Compared to previous leading trade indicators, the Kiel Trade Indicator is available much earlier, is much more comprehensive, relies on a uniquely large database using big data, and has a low statistical error by comparison. The algorithm of the Kiel Trade Indicator uses machine learning, so that the quality of the forecast continues to improve over time.