News
Freight Volume in the Red Sea Continues to Decline, Fewer Ships in Hamburg

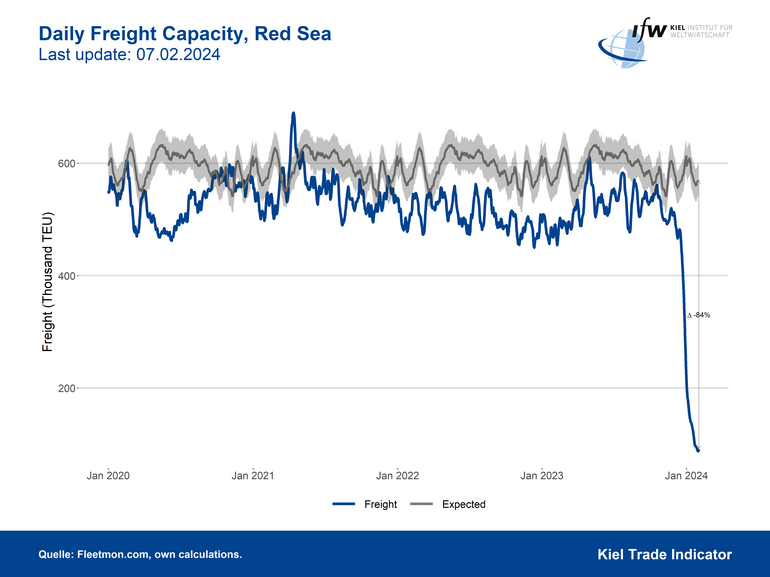
The reason for the drastic declines in freight volume is that container ships, following attacks by Houthi rebels, are now taking the detour around Africa and the Cape of Good Hope instead of passing through the Red Sea and the Suez Canal. This entails a detour of about two weeks. Around 10 percent of all globally shipped goods are affected by this.
"The presence of military forces of the USA and Great Britain have apparently not been able to ensure greater security on what was once the most heavily used trade route. However, the current situation appears more dramatic than it is economically. At the moment, we see that container ships are significantly delayed compared to their original plans, resulting in fewer ship arrivals in many European ports. However, this gap is expected to normalize once the longer travel route is logistically accounted for," says Julian Hinz, Research Director of Trade Policy and Head of the Kiel Trade Indicator.
Due to the detour, fewer ships frequent the eastern Mediterranean. Arrivals at ports in Southern and Northern Europe are being delayed. In Hamburg and Bremerhaven, as well as in Rotterdam and Antwerp, 25 percent fewer ships dock compared to the average numbers of 2023, as of January 2024.
However, the quantity of globally shipped goods increased in January, with the number of shipped standard containers reaching over 14 million units, close to the previous peak of around 2 years ago.
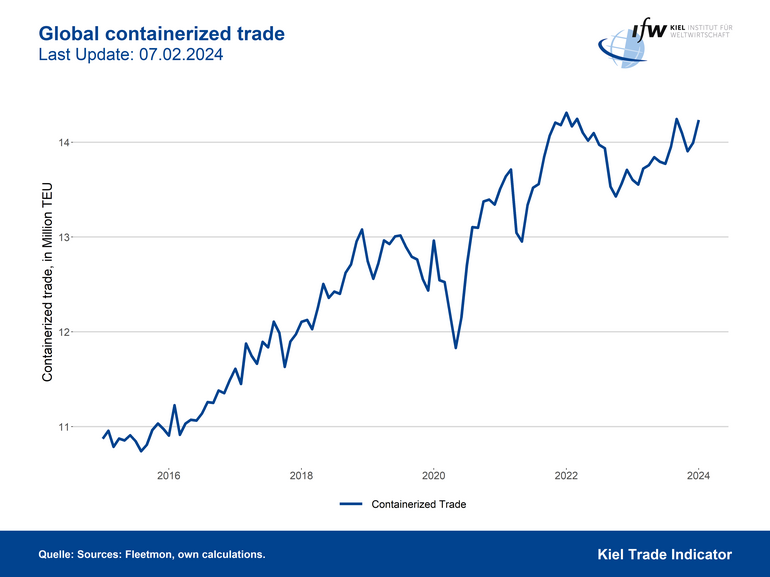
"The quantity of globally shipped goods, in particular, shows that global trade is not in crisis but has remained stable. While individual companies may suffer from delivery delays, overall, there are no shortages expected in raw materials or consumer goods," says Hinz. "One reason for the brisk trade activity may also lie in the Chinese New Year, as trade in China typically picks up before the holidays. However, it tends to decrease afterward."
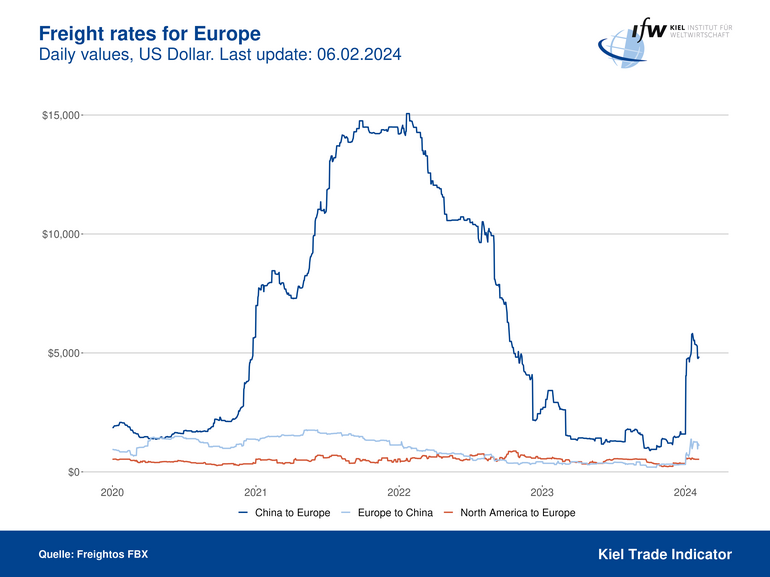
Meanwhile, freight rates on the routes from China to Europe– —which previously passed through the Red Sea and the Suez Canal—have significantly increased. In January, the rates for a standard container temporarily reached over 5,000 US dollars, but since then have decreased by about 15 percent. In November 2023, it was around 1,500 US dollars. However, the prices are still far below the record levels of 2022, when they reached nearly 15,000 US dollars. Freight costs for containers exported to Asia have also more than tripled.
"Global impacts due to the increases in transport costs are hardly noticeable, however; freight costs make up only a very small portion of the values of goods, and in high-priced electronics products such as laptops or mobile phones, the share is even only in the thousandths. Also, prices on the route from North America to Europe have remained almost unchanged since the start of the crisis in November 2023," says Hinz.
Due to technical reasons, the current update does not include a numerical graph showing the changes in imports and exports.
For more information on the Kiel Trade Indicator and forecasts for 75 countries and regions, visit www.ifw-kiel.de/tradeindicator.

About the Kiel Trade Indicator
The Kiel Trade Indicator estimates trade flows (imports and exports) of 75 countries and regions worldwide, the EU and world trade as a whole. Specifically, the estimates cover over 50 individual countries as well as regions such as the EU, sub-Saharan Africa, North Africa, the Middle East or emerging Asia. It is based on the evaluation of ship movement data in real time. An algorithm programmed at the Kiel Institute uses artificial intelligence to analyze the data and translates the ship movements into price and seasonally adjusted growth figures compared with the previous month.
We update the data once a month around the 5th and then present the latest calculations for trade in the current and the previous month.
Arriving and departing ships are recorded for 500 ports worldwide. In addition, ship movements in 100 maritime regions are analyzed and the effective utilization of container ships is derived from draught information. Country-port correlations can be used to generate forecasts, even for countries without their own deep-sea ports.
Compared to previous leading trade indicators, the Kiel Trade Indicator is available much earlier, is much more comprehensive, relies on a uniquely large database using big data, and has a low statistical error by comparison. The algorithm of the Kiel Trade Indicator uses machine learning, so that the quality of the forecast continues to improve over time.