Kiel Institute Highlights
Special Economic Zones: boon or bane for emerging country firms?
A good 20 percent of global trade originates from the approximately 4,300 Special Economic Zones (SEZs) worldwide (Hachmeier and Mösle, 2018). In these geographically delineated areas, which are generally located in emerging economies, countries concentrate infrastructure investments, provide monetary incentives, and create special regulatory frameworks to attract investment, mainly from abroad. SEZs are an important industrial policy measure designed to enable domestic firms to participate in the globalization process. However, our ongoing research suggests that this kind of preferential treatment for some companies may create disadvantages for others.
In the large-scale research project entitled “SEZs: A force for good to reduce inequality?” funded by the Swedish Riksbankens Jubileumsfond, researchers from the Kiel Institute, together with colleagues from Denmark, Ghana, India, and Vietnam, are evaluating the implications of SEZs for development and social inequality in emerging economies. In our research, the focus has thus far been on India. It was one of the first countries in Asia to recognize the importance and effectiveness of Export Processing Zones (EPZ, a forerunner of today’s SEZs with a slightly different objective) in promoting exports, with Asia’s first EPZ being established in the port city of Kandla, Gujarat state, in 1965.
While these EPZs were predominantly regarded as tools for export promotion, Special Economic Zones have a wider mandate and aim to be more general engines for economic growth. Motivated by the success of such SEZs in China (Wang, 2013), the Indian government announced a shift toward a new SEZ policy in April 2000. This policy aims to enable the establishment of SEZs in the private sector by offering high-quality infrastructure, attractive fiscal incentives, and minimum regulation. The policy came into effect in February 2006 with the main objectives of:
- generating additional economic activity,
- promoting the export of goods and services,
- promoting investment from domestic and foreign sources,
- creating employment opportunities, and
- developing infrastructure facilities.
SEZs have developed differently in India than in China
Compared to China, India’s SEZs have several distinctive features. Firstly, initial waves of Chinese SEZs targeted coastal regions with easy access to port and transportation networks, whereas in India there are no imposed restrictions on the geographic location of SEZs. Secondly, unlike China’s SEZs, which are large, open territories covering entire cities and spanning hundreds of thousands of hectares, SEZs in India are fenced-in zones, the smallest of which is only one hectare. Thirdly, in India, private investors or local authorities submit the proposal for establishing an SEZ, which is then reviewed by state and central government and finally approved by a special Board of Approval. In China, by contrast, the government assigns SEZ status to a particular area, which then seeks to attract foreign and domestic firms.
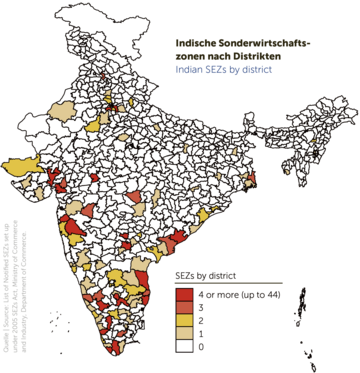
In 2020, there were 354 notified SEZs in India, of which 262 are operational. SEZs are clustered in districts around the coast and are predominantly located in the south of the country (figure 1), which is unsurprising given the access to ports and developed infrastructure. Interestingly, we also observed a within-district clustering of SEZs, meaning that up to 44 SEZs are concentrated in one district, whereas other districts have none.
Mapping of firms in the SEZs
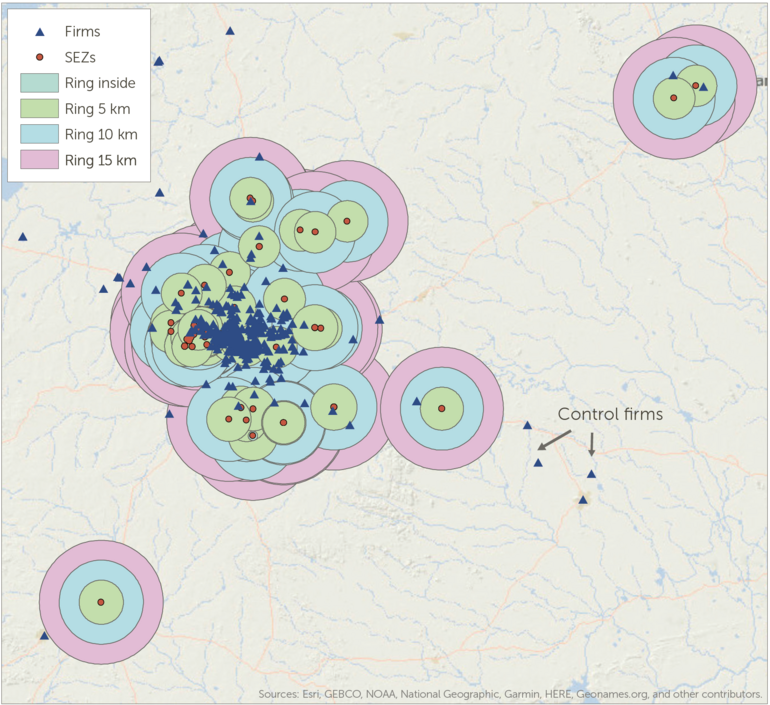
The blue triangles represent geocoded firms. The red dots represent geocoded SEZs. Using the information on the zones’ area, a radius is created and subsequently increased by 5 km.
Company data and detailed information on Special Economic Zones combined
In our research (Görg and Mulyukova, 2021), we focused on identifying the direct effect of SEZs on firms located inside the zones as well as the effect of SEZs on firms located in close geographical proximity to SEZs. A key novelty of the paper is that firms, rather than districts, are used as the unit of analysis. This allows for a more precise estimate of the impact of SEZs on firms (taking into account firm heterogeneity), compared to aggregating data at the administrative unit level.
For the research, two data sources were merged. One is a commercially available large-scale company level data set—Prowess; the second is a detailed list of notified SEZs. We geocoded both datasets and, using the information on the amount of land used, we created spatial rings of different radiuses around the center of the SEZ (figure 2). The core was created using the original size of the SEZs. The radius was then increased in increments of five kilometers to create the following distance bands: inside, 0–5 km, 5–10 km, and 10–15 km. To evaluate the impact of SEZs on firms, we compared the performance of firms before and after the introduction of the SEZ program in 2006.
Outlook: Companies in SEZs benefit significantly. At the expense of those that remain outside?
Preliminary findings indicate that firms located inside SEZs significantly improved their productivity growth as a result of the establishment of the SEZ—by up to 49 percent. Moreover, we observed a significant increase in firms’ sales growth, although there does not appear to be any effect on their export activity.
However, these positive observations also seem to have a negative side: interestingly, and in contrast to expected agglomeration economies, SEZs in India seem to have induced negative externalities on firms in the vicinity of SEZs, which appear to experience lower productivity growth. In line with the literature, we found that this effect attenuates with distance and was more pronounced for firms within 5 to 10 kilometers of SEZs. While this research is still ongoing, these findings already hint at an important implication for policy: while the establishment of SEZs may benefit firms inside, they may hurt firms located outside these zones.
Related Publication
References:
Görg, H., und A. Mulyukova (2022). Place-Based Policies and Agglomeration Economies: Firm-Level Evidence From Special Economic Zones in India.
Hachmeier, K.U., und S. Mösle (2018). Sonderwirtschaftszonen und Industrieparks in Theorie und Praxis – unter besonderer Berücksichtigung Afrikas. Kieler Beiträge zur Wirtschaftspolitik 23. IfW Kiel.
Wang, J. (2013). The Economic Impact of Special Economic Zones: Evidence From Chinese Municipalities. Journal of Development Economics (101): 133–147