News
Trade recedes in July, grain volume from Ukraine difficult to ship
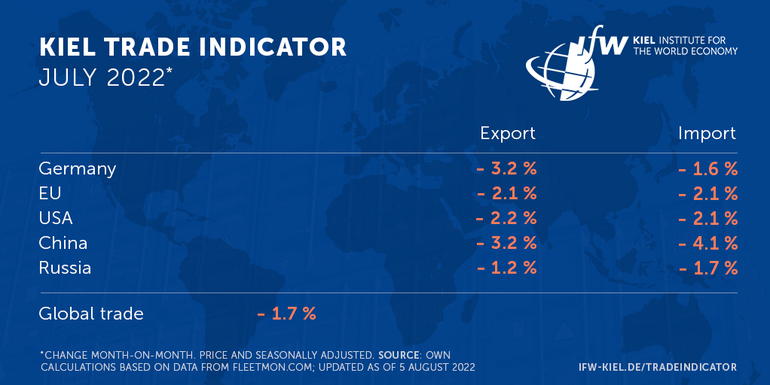
The latest data update of the Kiel Trade Indicator shows a decline of 1.7 percent in global trade inJuly compared with the previous month (price and seasonally adjusted). Indicator values are also negative for Germany (exports: -3.2 percent; imports: -1.6 percent), the EU (exports: -2.1 percent; imports: -2.1 percent), the U.S. (exports:-2.2 percent; imports: -2.1 percent), China (exports: -3.2 percent; imports: -4.1 percent), and Russia (exports: -1.2 percent; imports: -1.7 percent), indicating a decline in both exports and imports compared with June.
”The values are still within the normal fluctuation range and can be interpreted as a downward countermovement to some high increases in June. There is no threat of a crash in trade, but a trend reversal to the upside and a normalization of supply processes are not likely to occur any time soon either. Due to inflation, the gap between the official statistics without price adjustment and the Kiel Trade Indicator data with price adjustment is widening,” says Vincent Stamer, head of the Kiel Trade Indicator.
According to official trade statistics, German exports in June 2022 were up 18 percent on June 2021, but only by around 2 percent in price-adjusted terms. For world trade, data availability only allows a year-over-year comparison for May where nominal growth is up 36 percent, while price-adjusted growth is up only 5 percent.

There are now 24 container ships jammed in the German Bight waiting for clearance in Hamburg or Bremerhaven. Some of the ships have been there for about three weeks now. This has consequences for Germany's and the EU's trade with Asia. Cargo volumes in the Red Sea, the main trade route between the EU and Asia, are currently 21 percent lower than would be expected under normal circumstances. The gap is largely due to failing cargo from Europe to Asia. Congestion off Germany's North Sea ports is a contributing factor here, as container ships are unable to leave on time as a result. By contrast, the consequences of the lockdown at the port of Shanghai appear to have been overcome.

No containerized trade is still possible via the Ukrainian Black Sea port of Odessa. ”The fact that the Razoni, the first cargo ship in a long time, has now left to transport grain from the overflowing storage facilities is very positive news. However, in order to transport the remaining 20 million tons in time, around 570 additional shiploads would have to be handled in Ukrainian ports in the short term, which seems unachievable not only in view of the war. As the grain harvest is now picking up again and is in urgent need of the warehouse capacities, other transport options such as trains and trucks must also be fully utilized to move grain,” says Stamer.
Russia appears to be making progress in its efforts to substitute the lack of trade with the EU by trade with Asia. In Vladivostok and Novorossiysk, which are central to Asian trade, the number of arriving container ships is increasing significantly.

For more information on the Kiel Trade Indicator and forecasts for 75 countries and regions, visit www.ifw-kiel.de/tradeindicator.
The next update of the Kiel Trade Indicator will take place on August 23 (without media information) and on September 6 (with media information for August 2022 trade data).

About the Kiel Trade Indicator
The Kiel Trade Indicator estimates trade flows (imports and exports) of 75 countries and regions worldwide, the EU and world trade as a whole. Specifically, the estimates cover over 50 individual countries as well as regions such as the EU, sub-Saharan Africa, North Africa, the Middle East or emerging Asia. It is based on the evaluation of ship movement data in real time. An algorithm programmed at the Kiel Institute uses artificial intelligence to analyze the data and translates the ship movements into real, seasonally adjusted growth figures compared with the previous month.
We update the data twice a month. Around the 20th (without press release) for the current and the following month and around the 5th (with press release) for the previous and the current month.
Arriving and departing ships are recorded for 500 ports worldwide. In addition, ship movements in 100 maritime regions are analyzed and the effective utilization of container ships is derived from draught information. Country-port correlations can be used to generate forecasts, even for countries without their own deep-sea ports.
Compared to previous leading trade indicators, the Kiel Trade Indicator is available much earlier, is much more comprehensive, relies on a uniquely large database using big data, and has a low statistical error by comparison. The algorithm of the Kiel Trade Indicator uses machine learning, so that the quality of the forecast continues to improve over time.