News
Ship congestion in North Sea increases again, German exports below pre-COVID-19 level
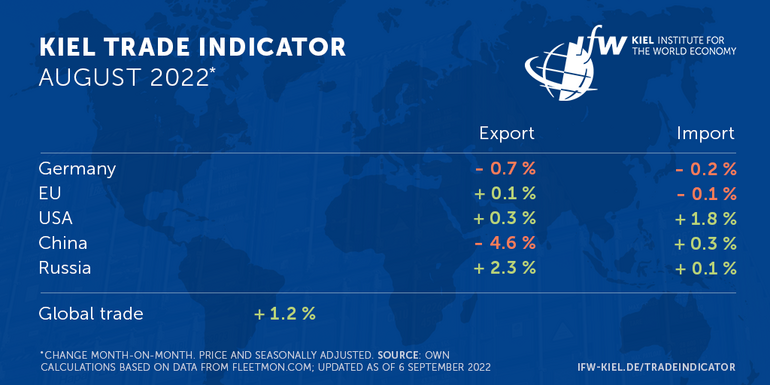
The latest data update of the Kiel Trade Indicator shows an increase of 1.2 percent in global trade in August compared with the previous month (price and seasonally adjusted). For Germany's trade, however, the signs are negative, with both imports (-0.2 percent) and exports (-0.7 percent) in the red. For the EU, there is virtually no change in sight, with imports (-0.1 percent) and exports (+0.1 percent) likely to be at the level of the previous month.
For U.S. imports, the Kiel Trade Indicator shows an increase of 1.8 percent compared to July, for exports of 0.3 percent. For China, the indicator value is negative for exports (-4.6 percent), and minimally positive for imports (0.3 percent). In Russia, exports (2.3 percent) are above the previous month's level, while imports (0.1 percent) are at the same level.
"Inflation mechanically increases exports in many countries, as rising prices also increase nominal trade values as typically reported in official statistics. In fact, however, price-adjusted exports of major industrialized countries are still below pre-pandemic 2019 levels. Supply bottlenecks are likely responsible in part for this development. Rising energy prices will put further pressure on the competitiveness of European companies in the short and medium term," says Vincent Stamer, Head of the Kiel Trade Indicator.
On the basis of Kiel Trade Indicator values, Germany is exporting around 7 percent fewer goods than in 2019. Data of the Bundesbank, from which a gap of 4 percent follows for July, indicates a similar trend. The gap is similar for France (almost 8 percent) as well as the United Kingdom (a good 6 percent) and smaller in Canada (3.5 percent) and the United States (a good 1 percent). Only Italy and Japan are exporting above their pre-COVID 19 levels again in the G7 group. World trade is over 6 percent above its pre-COVID 19 level.
Container congestion: most serious now in the North Sea
Congestion in container shipping is becoming entrenched at a high level. Currently, around 11 percent of all shipped goods are stuck. In the waiting areas observed by the Kiel Institute, congestion in the North Sea is the most serious for the first time. Well over 2 percent of global freight capacity is at a standstill there and can neither be loaded nor unloaded. In the German Bight alone, 19 container ships are waiting to unload their goods, 2 more than 14 days ago.

However, the queue off the U.S. states of South Carolina and Georgia, where the important container port of Savannah is located, is skyrocketing. Outside China's ports, congestion is on a cyclical downward trend. In the Red Sea, the most important sea trade route between Europe and Asia, 16 percent fewer goods are currently being shipped than would be expected under normal circumstances.

"Since the beginning of the year, freight rates for seaborne trade from Asia to Northern Europe and North America’s West Coast have dropped significantly from over 14,000 USD per Container to 4,000 and 8, 000 USD, respectively. However, congestion is preventing a return to pre-pandemic levels. High transportation costs are hindering a further recovery in global trade," Stamer says.
For more information on the Kiel Trade Indicator and forecasts for 75 countries and regions, visit www.ifw-kiel.de/tradeindicator.
The next update of the Kiel Trade Indicator will take place on September 21 (without press release) and on October 6 (with press release) for September trade data.

About the Kiel Trade Indicator
The Kiel Trade Indicator estimates trade flows (imports and exports) of 75 countries and regions worldwide, the EU and world trade as a whole. Specifically, the estimates cover over 50 individual countries as well as regions such as the EU, sub-Saharan Africa, North Africa, the Middle East or emerging Asia. It is based on the evaluation of ship movement data in real time. An algorithm programmed at the Kiel Institute uses artificial intelligence to analyze the data and translates the ship movements into real, seasonally adjusted growth figures compared with the previous month.
We update the data twice a month. Around the 20th (without press release) for the current and the following month and around the 5th (with press release) for the previous and the current month.
Arriving and departing ships are recorded for 500 ports worldwide. In addition, ship movements in 100 maritime regions are analyzed and the effective utilization of container ships is derived from draught information. Country-port correlations can be used to generate forecasts, even for countries without their own deep-sea ports.
Compared to previous leading trade indicators, the Kiel Trade Indicator is available much earlier, is much more comprehensive, relies on a uniquely large database using big data, and has a low statistical error by comparison. The algorithm of the Kiel Trade Indicator uses machine learning, so that the quality of the forecast continues to improve over time.