News
Freight rates drop significantly, congestion in German Bight recedes
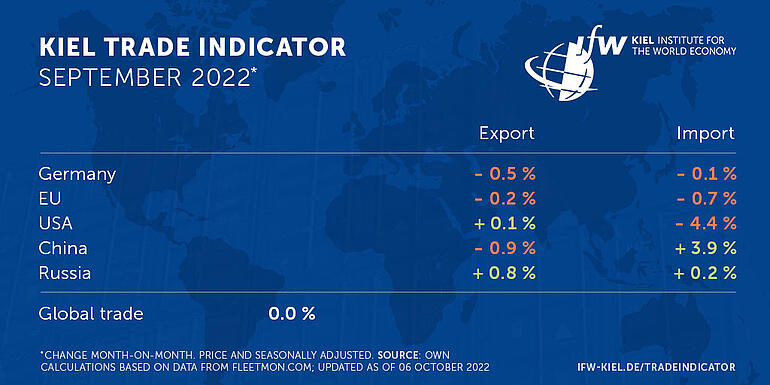
According to the latest data update of the Kiel Trade Indicator, world trade stagnated in September compared with the previous month (price and seasonally adjusted). For Germany's trade, the figures for imports (-0.5 percent) and exports (-0.1 percent) are slightly negative. There are also signs of little change in trade for the EU, with imports (-0.7 percent) and exports (-0.2 percent) likely to be slightly below or at the level of the previous month.
For the USA, thevalues of the Kiel Trade Indicator signal somewhat more movement in trade, with imports (-4.4 percent) clearly down on August. Exports (+0.1 percent) are expected to stagnate. For China, thereis a plus in imports (3.9 percent) and a minus in exports (-0.9 percent). Russia can expect a slight increase in imports (+0.2 percent) and exports (+0.8 percent).
"September trade has been characterized by weak demand for goods from China through Europe and North America," says Vincent Stamer, head of Kiel Trade Indicator. "This is reflected in the weak readings for EU and US imports and overall global trade, but most importantly in the sharp decline in freight rates for goods shipments from China to North America and Europe."
After the outbreak of the Corona pandemic in the spring of 2020, supply and demand in global goods traffic lost balance—the availability of freight capacity and goods fell, but demand rose, especially for goods from China for home work, sports, and entertainment.
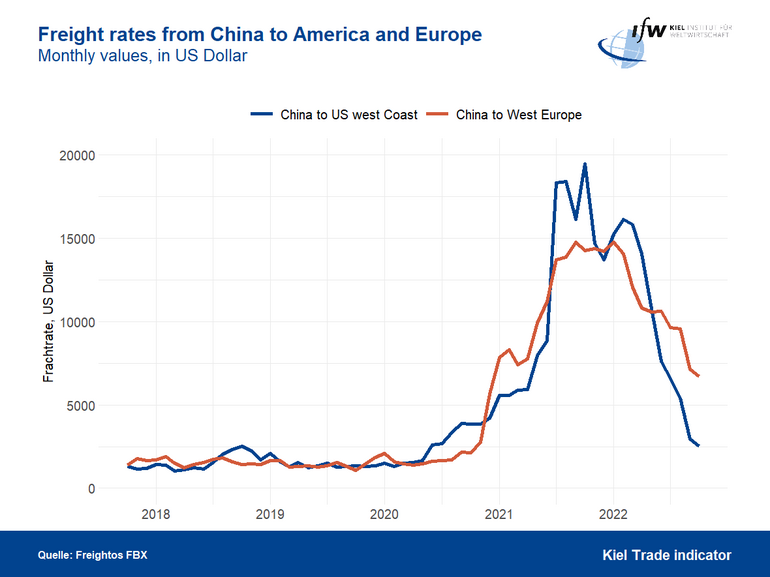
As a result, freight rates exploded to up to ten times the transport costs that had been the norm for many years. They have been falling rapidly for around four months, and on the route from China to the US West Coast freight rates are almost back to pre-crisis levels. On the route from China to Western Europe, the pre-crisis level has not quite been reached again.
"A slowdown in global trade could also be something positive if overstretched supply chains and traffic congestion recover as a result of the respite. After all, despite the high order backlog, supply bottlenecks are still holding back higher growth in Germany’s price adjusted exports, they are following a negative trend for the third month in succession now" says Stamer.
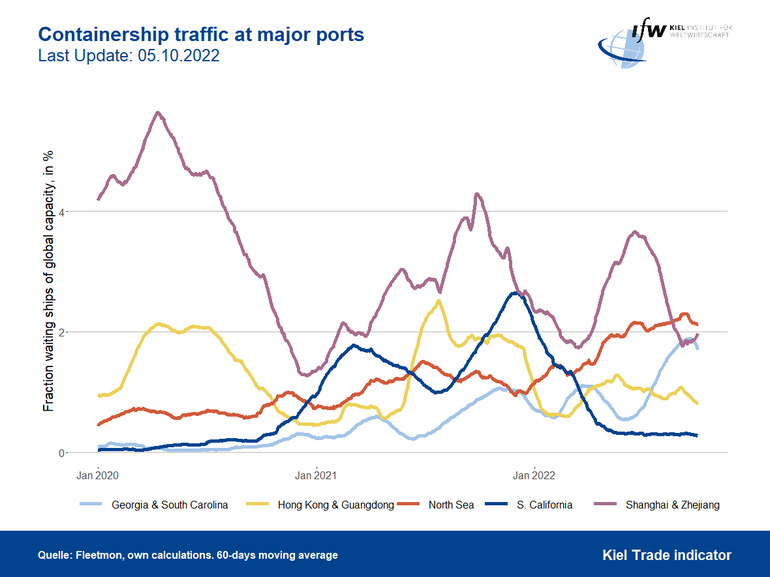
Just under 12 percent of all shipped goods are currently stuck in congestion. Of the waiting areas observed by Kiel Institute, congestion in the North Sea continues to be the most serious, tying up more than 2 percent of global freight capacity that can neither be loaded nor unloaded. In the German Bight, however, the congestion is receding, with only 12 container ships still waiting here for clearance in Hamburg or Bremerhaven. A month ago, there were 19.
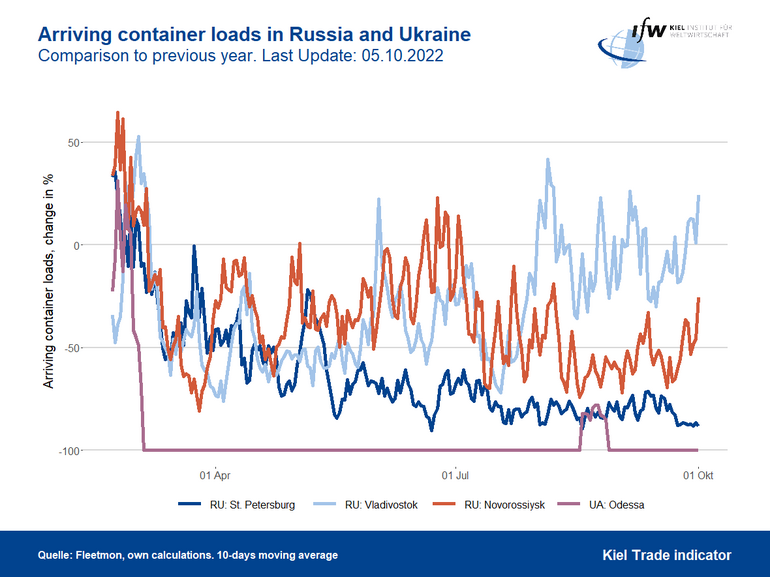
Russia appears to be making progress in its efforts to substitute trade the lack of trade with the EU by trade with Asia. In the ports of Vladivostok and Novorossiysk, which are central to Asian trade, the number of arriving container ships is steadily increasing as a trend. "However, imports from Asia have not yet been able to replace trade with Europe," Stamer said.
For more information on the Kiel Trade Indicator and forecasts for 75 countries and regions, visit www.ifw-kiel.de/tradeindicator.
The next update of the Kiel Trade Indicator will take place on October 21 **POSTPONED TO OCTOBER 24** (without media information) and on November 7 (with media information for October trade data).

About the Kiel Trade Indicator
The Kiel Trade Indicator estimates trade flows (imports and exports) of 75 countries and regions worldwide, the EU and world trade as a whole. Specifically, the estimates cover over 50 individual countries as well as regions such as the EU, sub-Saharan Africa, North Africa, the Middle East or emerging Asia. It is based on the evaluation of ship movement data in real time. An algorithm programmed at the Kiel Institute uses artificial intelligence to analyze the data and translates the ship movements into real, seasonally adjusted growth figures compared with the previous month.
We update the data twice a month. Around the 20th (without press release) for the current and the following month and around the 5th (with press release) for the previous and the current month.
Arriving and departing ships are recorded for 500 ports worldwide. In addition, ship movements in 100 maritime regions are analyzed and the effective utilization of container ships is derived from draught information. Country-port correlations can be used to generate forecasts, even for countries without their own deep-sea ports.
Compared to previous leading trade indicators, the Kiel Trade Indicator is available much earlier, is much more comprehensive, relies on a uniquely large database using big data, and has a low statistical error by comparison. The algorithm of the Kiel Trade Indicator uses machine learning, so that the quality of the forecast continues to improve over time.